Метрики хостов
Метрики хостов заранее настроены в StatsHouse:
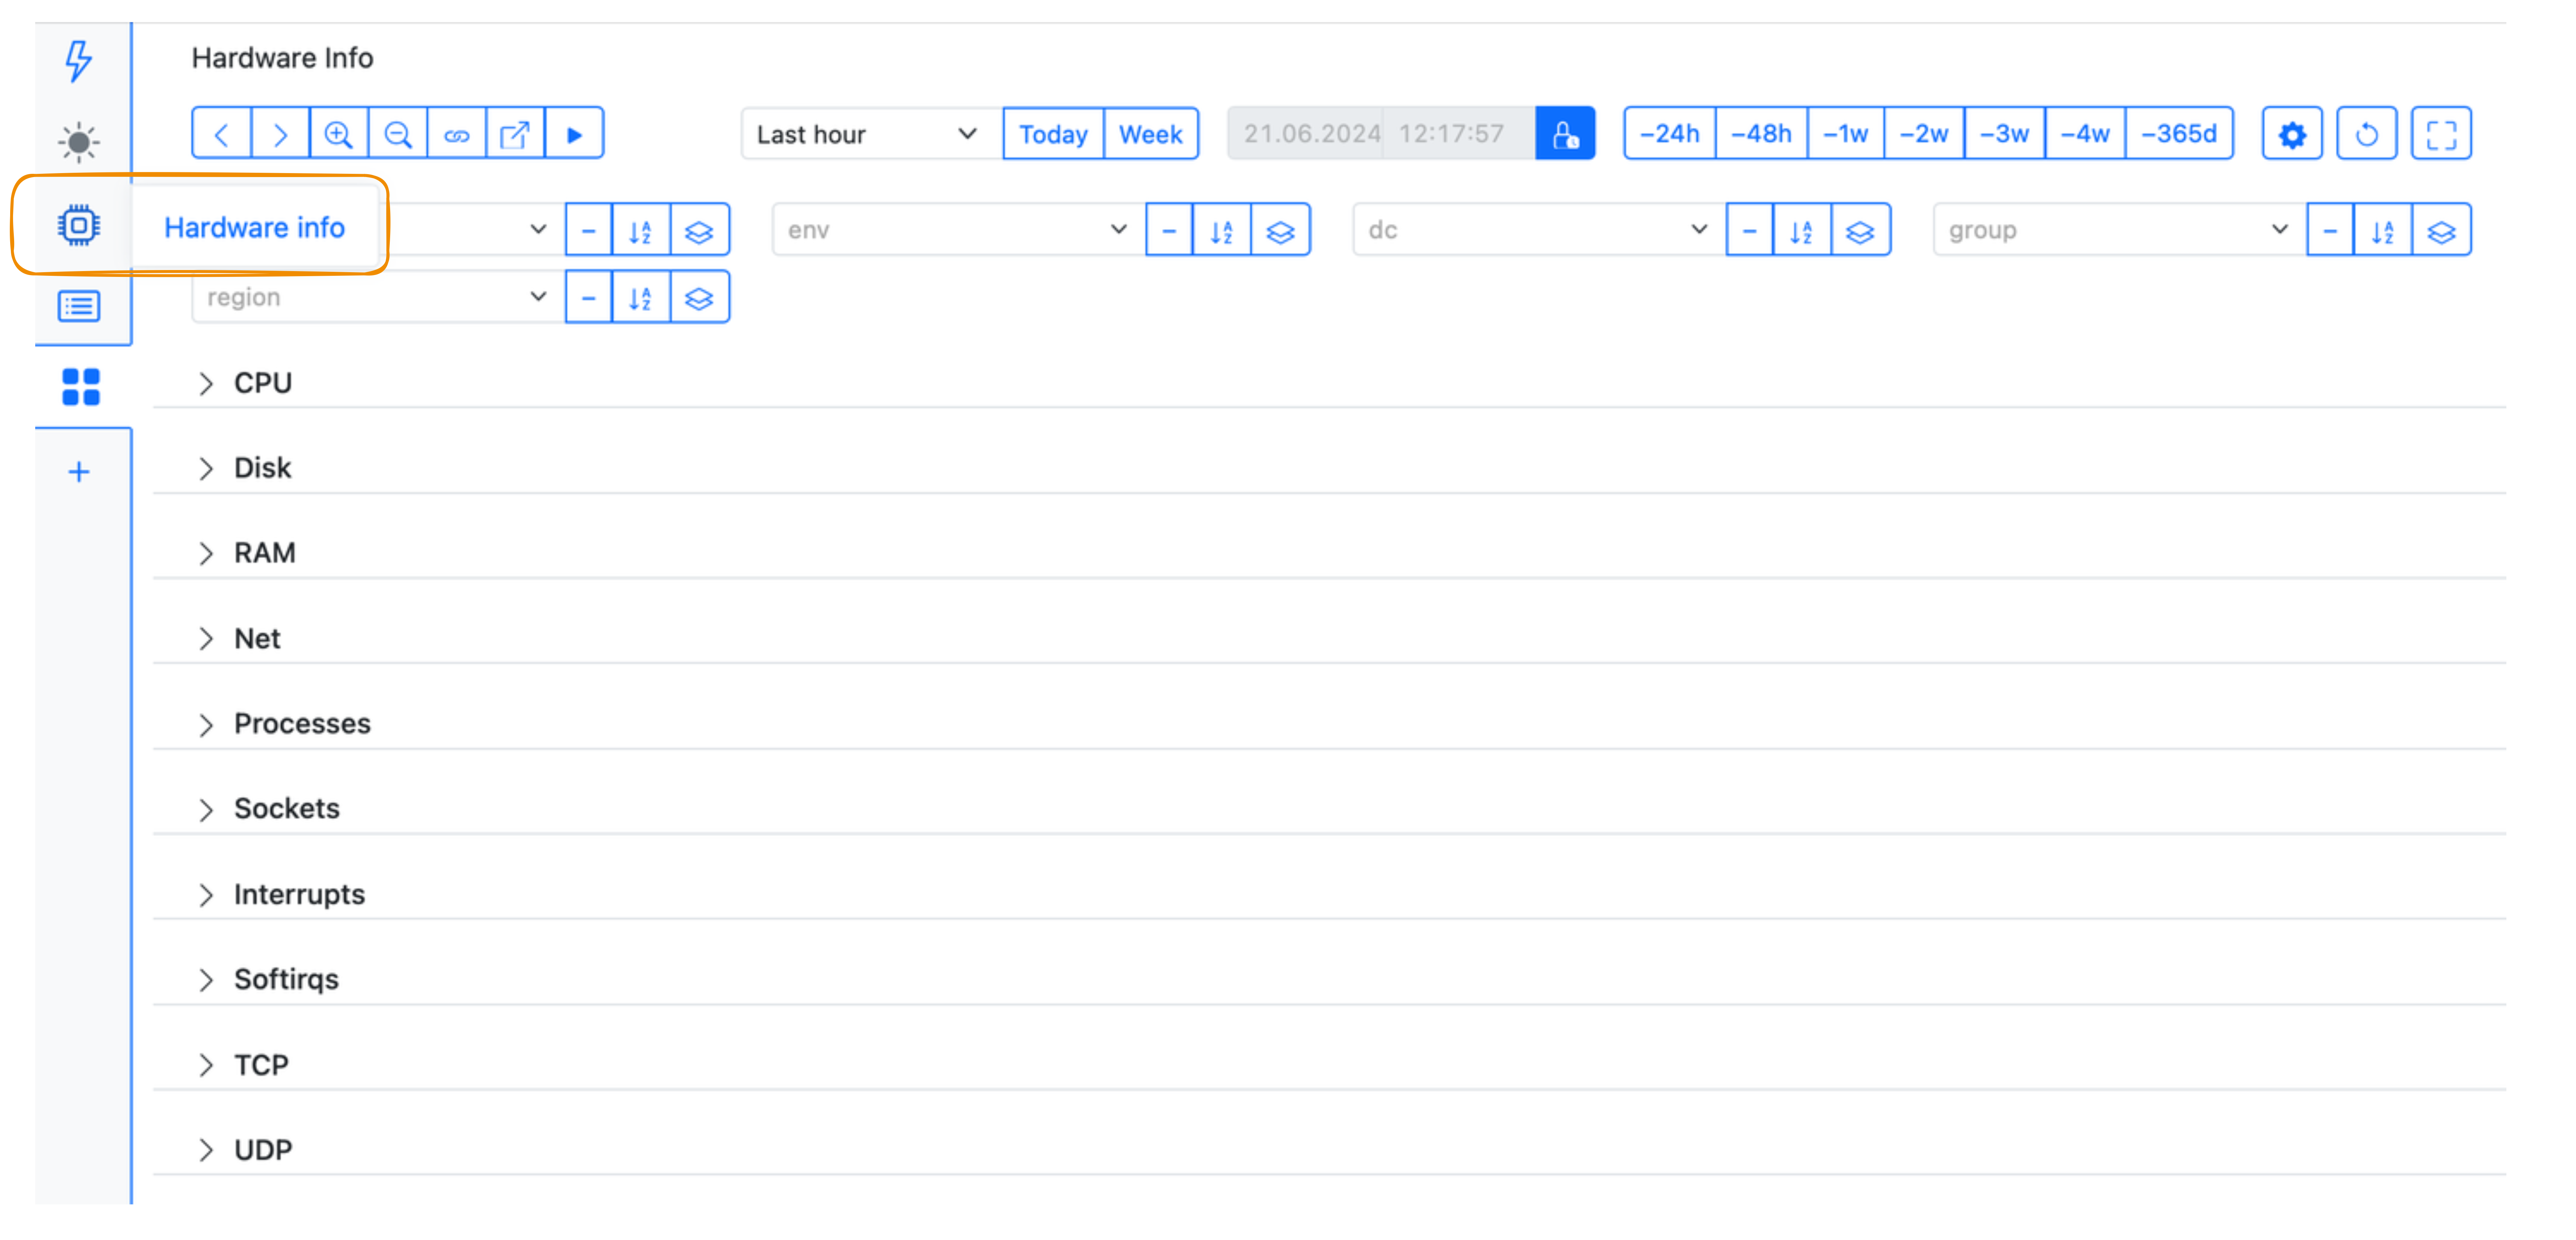
- их можно просматривать на отдельных графиках (названия метрик начинаются с
host_), - их можно посмотреть на дашборде Hardware info.
Узнайте, как использовать теги для метрик хостов.
Реализацию этих метрик можно найти на GitHub. Полный список приведён в таблице ниже.
Описания скопированы из кода на GitHub. Мы позже дополним их, в том числе описаниями тегов.
| # | Metric name | Description |
|---|---|---|
| 1 | host_cpu_usage | The number of seconds the CPU has spent performing different kinds of work |
| 2 | host_softirq | Total number of software interrupts in the system |
| 3 | host_irq | Total number of interrupts in the system |
| 4 | host_context_switch | Total number of context switch in the system |
| 5 | host_mem_usage | Amount of free and used memory in the system |
| 6 | host_mem_writeback | Writeback/Dirty memory |
| 7 | host_block_io_time | The amount of time to transfer data to and from disk. Count - number of operations, Value - wait time for handle operations |
| 8 | host_block_io_size | The amount of data transferred to and from disk. Count - number of operations, Value - size |
| 9 | host_disk_usage | Disk space utilization |
| 10 | host_inode_usage | The number of free and used inodes in a filesystem |
| 11 | host_system_uptime | The amount of time the system has been running |
| 12 | host_system_process_created | Number of processes and threads created |
| 13 | host_system_process_status | Number of processes currently blocked, waiting IO or running on CPUs |
| 14 | host_system_psi_cpu | PSI for CPU (some, full) |
| 15 | host_system_psi_mem | PSI for memory |
| 16 | host_system_psi_io | PSI for IO |
| 17 | host_net_packet | Number of transferred packets grouped by protocol |
| 18 | host_net_error | Number of network errors |
| 19 | host_net_bandwidth" // total | Total bandwidth of all physical network interfaces. Count - number of packets, Value - number of bytes |
| 20 | host_net_dev_bandwidth | Total bandwidth of all physical network interfaces. Count - number of packets, Value - number of bytes |
| 21 | host_net_dev_error | Count of receive/transmit errors |
| 22 | host_net_dev_drop | Count of packets dropped while receiving/transmitting |
| 23 | host_socket_memory | The amount of memory used by TCP sockets in all states |
| 24 | host_tcp_socket_status | The number of TCP socket grouped by state |
| 25 | host_tcp_socket_memory | The amount of memory used by sockets |
| 26 | host_socket_used | The number of socket in inuse state grouped by protocol |
| 27 | host_page_fault | The number of page fault |
| 28 | host_paged_memory | The amount of memory paged from/to disk |
| 29 | host_oom_kill | The number of OOM |
| 30 | host_numa_events | NUMA events |
| 31 | host_dmesg_events | dmesg events |
| 32 | host_oom_kill_detailed | The number of killed OOM processes (tagged by process) |
Как использовать теги для метрик хостов
Чтобы настроить значения тегов для метрик хостов, используйте дополнительный параметр --env-file-path
при запуске агента.
По умолчанию используется файл /etc/statshouse_env.yml.
Вы можете указать свой YAML-файл в параметре командной строки:
--env-file-path my_env.yml
В этом файле укажите значения для стандартных тегов, используемых в метриках хостов.
Чтобы пользоваться тегами было удобнее, договоритесь с командами в вашей организации,
какие значения тегов допустимы.
Например, все должны использовать значение production, а не prod, Production и т. д.