Use hardware (host) metrics
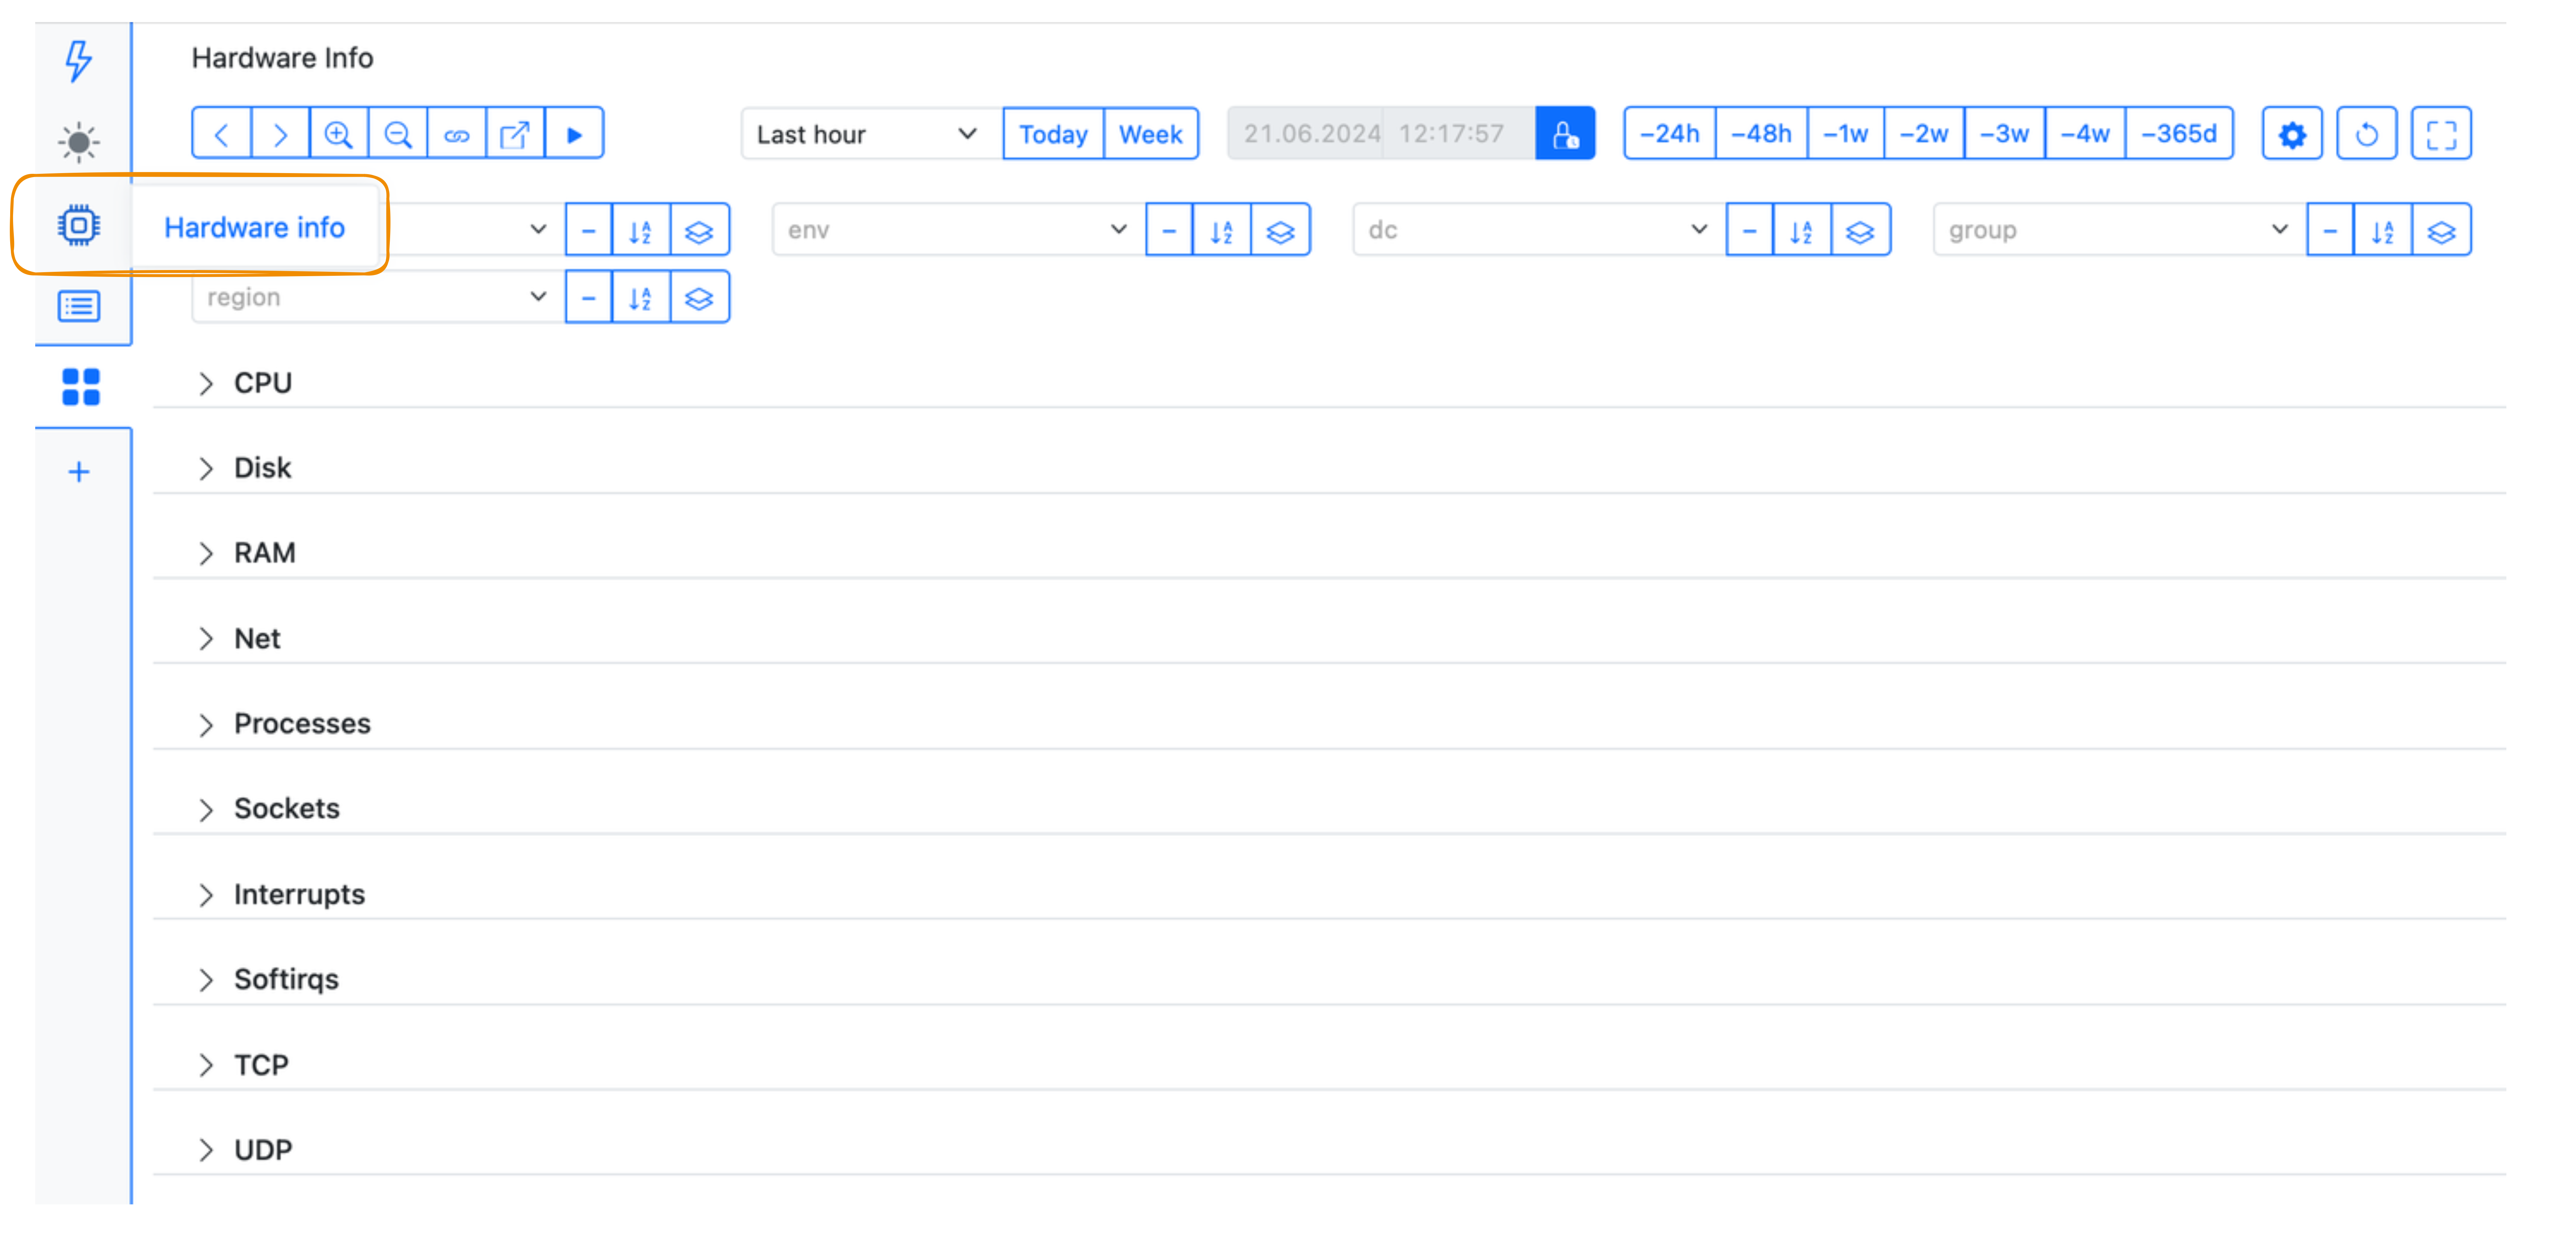
Popular hardware (host) metrics are displayed in StatsHouse out of the box:
- You can view them as individual metrics: host metric names begin with
host_. - You can view them on the Hardware info dashboard:

Find the host metrics implementation on GitHub.
Learn how to use tags for the host metrics.
Find the full list of host metrics in the table below.
The descriptions are now copied from GitHub and will be updated later with more detail as well as tag information.
| # | Metric name | Description |
|---|---|---|
| 1 | host_cpu_usage | The number of seconds the CPU has spent performing different kinds of work |
| 2 | host_softirq | Total number of software interrupts in the system |
| 3 | host_irq | Total number of interrupts in the system |
| 4 | host_context_switch | Total number of context switch in the system |
| 5 | host_mem_usage | Amount of free and used memory in the system |
| 6 | host_mem_writeback | Writeback/Dirty memory |
| 7 | host_block_io_time | The amount of time to transfer data to and from disk. Count - number of operations, Value - wait time for handle operations |
| 8 | host_block_io_size | The amount of data transferred to and from disk. Count - number of operations, Value - size |
| 9 | host_disk_usage | Disk space utilization |
| 10 | host_inode_usage | The number of free and used inodes in a filesystem |
| 11 | host_system_uptime | The amount of time the system has been running |
| 12 | host_system_process_created | Number of processes and threads created |
| 13 | host_system_process_status | Number of processes currently blocked, waiting IO or running on CPUs |
| 14 | host_system_psi_cpu | PSI for CPU (some, full) |
| 15 | host_system_psi_mem | PSI for memory |
| 16 | host_system_psi_io | PSI for IO |
| 17 | host_net_packet | Number of transferred packets grouped by protocol |
| 18 | host_net_error | Number of network errors |
| 19 | host_net_bandwidth" // total | Total bandwidth of all physical network interfaces. Count - number of packets, Value - number of bytes |
| 20 | host_net_dev_bandwidth | Total bandwidth of all physical network interfaces. Count - number of packets, Value - number of bytes |
| 21 | host_net_dev_error | Count of receive/transmit errors |
| 22 | host_net_dev_drop | Count of packets dropped while receiving/transmitting |
| 23 | host_socket_memory | The amount of memory used by TCP sockets in all states |
| 24 | host_tcp_socket_status | The number of TCP socket grouped by state |
| 25 | host_tcp_socket_memory | The amount of memory used by sockets |
| 26 | host_socket_used | The number of socket in inuse state grouped by protocol |
| 27 | host_page_fault | The number of page fault |
| 28 | host_paged_memory | The amount of memory paged from/to disk |
| 29 | host_oom_kill | The number of OOM |
| 30 | host_numa_events | NUMA events |
| 31 | host_dmesg_events | dmesg events |
| 32 | host_oom_kill_detailed | The number of killed OOM processes (tagged by process) |
How to use tags for the hardware (host) metrics
To configure tag values for the host metrics, use the optional --env-file-path
parameter when starting the agent.
The default file is /etc/statshouse_env.yml. You can specify your YAML file as the command line parameter:
--env-file-path my_env.yml
In this file, specify the values for the standard host metric tags.
For your convenience, define the way the teams in your organization name the tag values.
For example, all the teams should use the production value — not the prod, Production, etc.