TLDR
The main StatsHouse feature is the ability to "digest" as much data as you need and to display it in real time. It is possible due to aggregation and sampling: StatsHouse has to "compress" and (sometimes) to discard data.
You can't get rid of sampling in general. And most of the time you don't need to.
To see whether StatsHouse suits you well, have a quick glance at its basic concepts and mechanisms. They are described below — in a couple of words and pictures:
Aggregation
Learn more about aggregation in the conceptual overview. This is just the TLDR.
StatsHouse "collapses" rows of data with the same tag values. The counters are summed up.

StatsHouse does NOT store an exact metric value per each moment. It stores the general statistics (aggregate = count, sum, min, max) for a time interval.
The maximum resolution is one second. Per-second data is available for two days, then the resolution decreases (to minutes and hours).
Cardinality
Learn more about cardinality in the conceptual overview. This is just the TLDR.
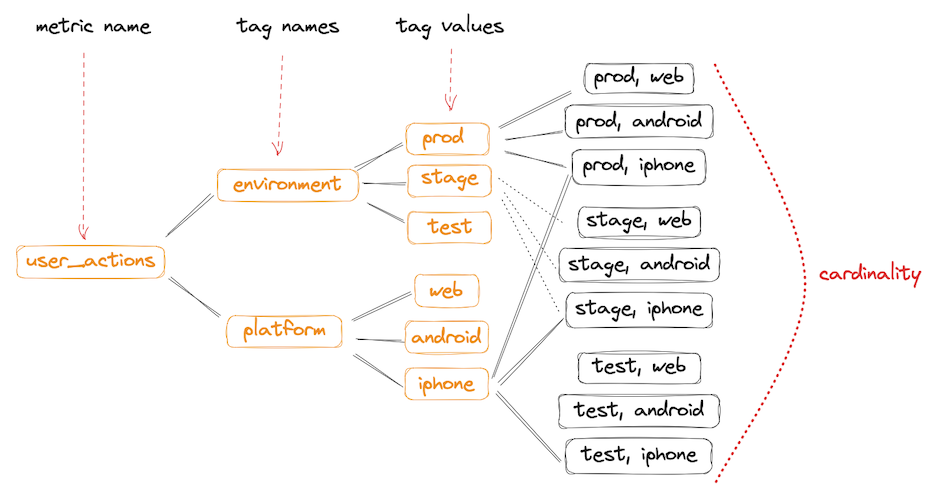
High cardinality data is data with many different tag values. It is poorly aggregated, takes up a lot of space — StatsHouse has to sample it.
Low cardinality data is aggregated (compressed) well, and StatsHouse usually does not have to sample it.

Sampling
Learn more about sampling in the conceptual overview. This is just the TLDR.
When the loads are too high, StatsHouse samples data — throws away random data rows. It multiplies the sums and counts in the remaining rows by a sampling coefficient to preserve the average statistics.
StatsHouse does not guarantee the absence of sampling.


In most cases, users do not worry about sampling. And it still protects StatsHouse from overload.
StatsHouse does not guarantee the absence of sampling
You can't get rid of sampling in general. StatsHouse is designed to be a communal cluster: the resource is shared fairly between the tenants.
The tenant's resource is the share of total resource. If the total resource has already been shared between the tenants in your organization and there are no more new ones, the tenants' metrics will not interfere with each other, so you can try to minimize sampling.
When scaling the system (adding new demanding tenants) the actual budget in bytes may decrease. In real organizations, one should increase the total resource by scaling the physical cluster.
How to minimize sampling
StatsHouse samples data when you send more metric data than allowed. You can either decrease the amount of data sent (1–3), or increase the budget (4).
- Minimize cardinality — the number of tag values. It is not the number of tags that matters. The number of tag values is what you should care about.
Do not use userID or hostname as tag values. Use larger categories.
Categorize users by a region, platform, etc. — not by their personal IDs.
Categorize hosts by a datacenter, a cluster, etc. — not by their names.
- Consider the metric type — it influences the amount of data sent:
- counter metrics takes up less space than value metrics;
- enabling percentiles increases the amount of data sent — it may lead to increased sampling.
- Reduce the metric resolution. Learn how to customize resolution.
- Increase the budget. Only administrators are allowed to manage budgets for specific metrics (as well as groups and namespaces). Use this option sparingly.
You can enable the "Fair key tags" feature to share the budget fairly between the services sending data to the same metric. Read more about tag-level budgeting.
Things that do not minimize sampling
If you send a lot of rows and start writing less data to the same rows, the sampling rate will not reduce.
Imagine you send two data rows: [a=1, b=2] и [a=1, b=3] — they are different rows because they contain
different tag values. It does not matter if you write four values or one million values to these rows (it works for
counter and value types). But if your metric generates two million rows per second, they will likely be
sampled.
Why StatsHouse cannot guarantee the absence of sampling
You can't get rid of sampling in general. StatsHouse is designed to work as a communal cluster: the resource is fairly distributed among tenants.
The resource allocated to a tenant is the fixed percentage of the total resource. If the resource in your organization has already been distributed among tenants and there are no new ones, then tenants will not interfere with each other, and it is even possible to empirically minimize sampling.
Upon scaling (when new tenants appear), the actual budget in bytes may decrease. To solve this problem in the real organization, one should increase the total budget, i.e., physically scale up the cluster.