Design your metric
Understand what you want from your metric and how to implement it with StatsHouse:
Then create a metric and start sending data.
What are metrics in StatsHouse?
By "monitoring," we mean getting statistical data. A metric is the minimal unit for setting up, collecting, and viewing statistics.
A metric structure in StatsHouse looks like this:
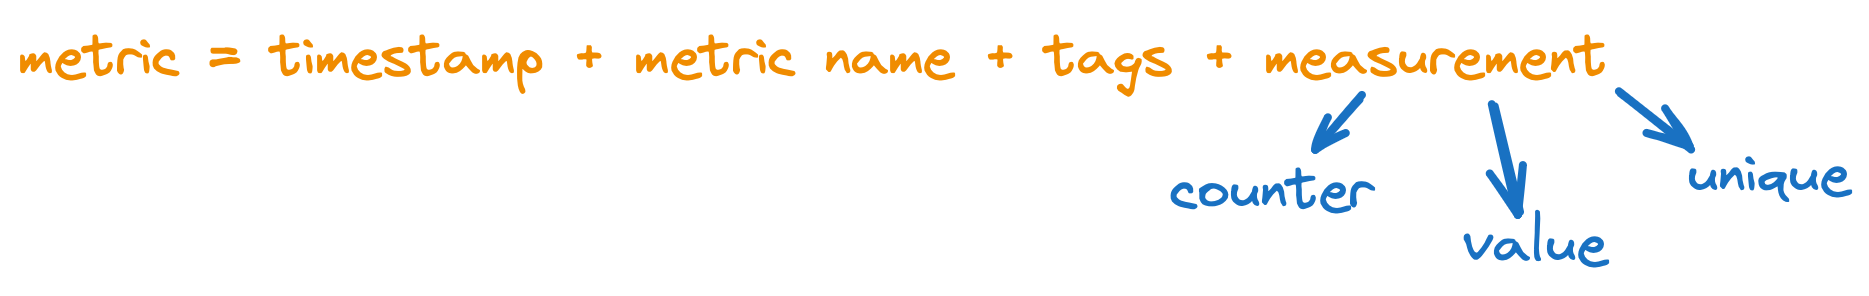
Here, counter, value, and unique are basic metric types in StatsHouse.
StatsHouse does not store an exact metric value per each moment.
It stores aggregates associated with time intervals.
Metric types
You can measure same things in different ways—they are metric types.
See the table below for definitions and examples:
| Metric type | What does it measure? | Examples |
|---|---|---|
counter | It counts the number of times an event has occurred. | The number of API method calls The number of requests to a server The number of errors received while sending messages |
value | It measures magnitude of a parameter. A measurement event itself is counted as well. | How long does it take for a service to generate a newsfeed? What is CPU usage for this host? What is the response size (in bytes)? |
unique | It counts the number of unique events. The total number of events is counted as well. | The number of unique users who sent packages to a service |
A metric type affects the range of descriptive statistics available for your metric to view and analyze. For example, percentiles are available for values only. Or you cannot view the cumulative graph for uniques.
See more about enabling percentiles and showing descriptive statistics in the UI.
Metric types should not be confused with data types in programming languages.
Implementation details
Counter and value metrics are float64. When StatsHouse receives metric data of a counter or value type,
it trims everything outside the [-max(float32)..max(float32)] range.
Thus, you avoid getting positive or negative infinity (±inf) while summarizing values—in the database as well.
Counters
Imagine a hypothetical product. For this product, we need to get the number of received packets per second. The packets may have different formats and statuses.
Each time an application receives a packet, it sends an event to StatsHouse:
{"metrics":[ {"name": "toy_packets_count",
 "tags":{"format": "JSON", "status": "ok"},
 "counter": 1}] }
or
{"metrics":[ {"name": "toy_packets_count",
 "tags":{"format": "TL", "status": "error_too_short"},
 "counter": 1} ]}
Let's represent an event as a row in a conventional database. Upon per-second aggregation, we'll get the table below—for each tag value combination received, we get the row with the corresponding count:
| timestamp | metric | format | status | counter |
|---|---|---|---|---|
| 13:45:05 | toy_packets_count | JSON | ok | 100 |
| 13:45:05 | toy_packets_count | TL | ok | 200 |
| 13:45:05 | toy_packets_count | TL | error_too_short | 5 |
The number of rows in such a table is a metric's cardinality.
Value metrics
Suppose we want to monitor the size of the received packets. This is what our metric could look like:
{"metrics":[ {"name": "toy_packets_size",
 "tags":{"format": "JSON", "status": "ok"},
 "value": [150]} ]}
or
{"metrics":[ {"name": "toy_packets_size",
 "tags":{"format": "JSON", "status": "error_too_short"},
 "value": [0]} ]}
When you use value metrics, StatsHouse calculates an aggregate in addition to a counter: sum, min, max.
| timestamp | metric | format | status | counter | sum | min | max |
|---|---|---|---|---|---|---|---|
| 13:45:05 | toy_packets_size | JSON | ok | 100 | 13000 | 20 | 1200 |
| 13:45:05 | toy_packets_size | TL | ok | 200 | 7000 | 4 | 800 |
| 13:45:05 | toy_packets_size | TL | error_too_short | 5 | 10 | 0 | 8 |
The value metric is an array, so you can send several values at a time.
Sending regular values
If you need to record a value per second (a "water level"), the StatsHouse client libraries try to send each value in the middle of the calendar second. Agents finalize the second in accordance to a calendar second. StatsHouse does not ensure that each second contains exactly one measurement but tries to make it more probable. If you need to ensure this, add the timestamp explicitly.
Unique counters
A unique counter is the number of unique integer values. For the string values, hashes are used.
Suppose we receive packets containing the senders' IDs. We can count how many distinct senders there are:
{"metrics":[ {"name": "toy_packets_user",
 "tags":{"format": "JSON", "status": "ok"},
 "unique": [17]} ]}
The unique value is an array, so you can send several values at a time.
| timestamp | metric | format | status | counter | unique |
|---|---|---|---|---|---|
| 13:45:05 | toy_packets_user | JSON | ok | 100 | uniq(17, 19, 13, 15) |
| 13:45:05 | toy_packets_user | TL | ok | 200 | uniq(17, 19, 13, 15, 11) |
| 13:45:05 | toy_packets_user | TL | error_too_short | 5 | uniq(51) |
StatsHouse uses the HyperLogLog-like function: the values themselves are inaccessible, so you can only estimate the cardinality for the sets.
For unique metrics, StatsHouse stores the aggregates: sum, min, max (the same as for the value metrics
interpreted as int64 and approximated to float64). Knowing the range of values may be useful for debugging.
Implementation details
Unique counters are int64—StatsHouse interprets it as 64 bits. They are not uint64 just because some
programming languages does not have it. These values are regarded as hashes. When estimating cardinality for the
sets of these values, StatsHouse tests them for equality and inequality.
When producing aggregates (sum, min, max), StatsHouse interprets these values as int64 and then converts
them into float64 as the column for these aggregates are the same as for the value aggregates.
Combining metric types
Check the valid metric type combinations in the table below:
| What you send | What you get |
|---|---|
"counter":100 | counter |
"value":[1, 2, 3] | counter (the size of the array), value (sum, min, max) |
"unique":[17, 25, 37] | counter (the size of the array), value (sum, min, max), unique |
"counter":6, "value":[1, 2, 3] | User-guided sampling |
"value":100,"unique":100 |
If you refactor your existing metric, i.e., switch between different metric types for a single metric, the data may become confusing or uninformative.
Keep sending data of the same type per metric.
Counters for value and unique metrics
If you send a value or unique array, the size of this array becomes the counter for this metric.
Thus, you should not implement a separate counter metric for your value or unique metrics.
You still can specify counter to implement
user-guided sampling.
Tags
Use tags to differentiate the characteristics of what you measure, the contributing factors, or a context.
Tags are additional dimensions you use to filter or group your data. They are sometimes mentioned as "labels" or "keys." Tags are the name-value pairs.
Imagine you conducting an A/B test: which color-text combination is better for a button? You measure the number of clicks per button and use the tags:
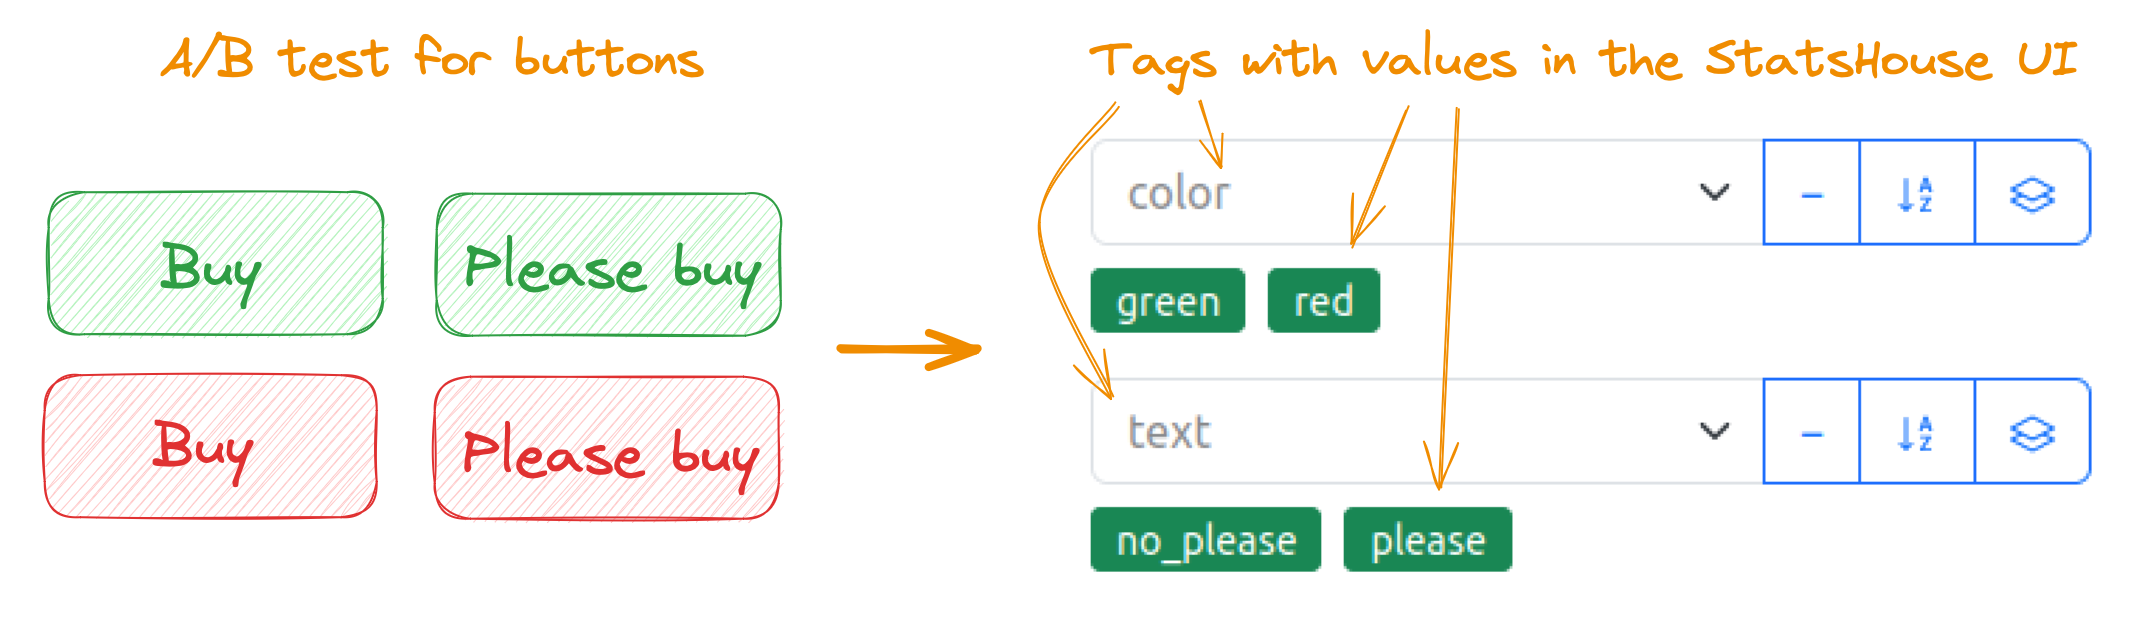
Tagged metrics help to verify hypotheses about your data. For monitoring, troubleshooting, or other purposes, you may ask questions like these:
"Does the error rate differ for platforms?"
or
"What is the region we have the highest request rate from? Does it differ for environments?"
For these example questions, you may send metrics (here, using the client library for Python):
statshouse.value("error_rate", {"platform": "web"}, 42.5)
                   ↑                 ↑         ↑      ↑
                metric name          ↑         ↑   measurement
                                 tag name      ↑
                                             tag value
or
statshouse.value("request_rate", {"env": "production", "region": "moscow"}, 42.5)
                   ↑                 ↑         ↑           ↑        ↑         ↑
                metric name          ↑         ↑           ↑        ↑      measurement
                                 tag name      ↑       tag name     ↑
                                             tag value            tag value
Then you can filter or group your data using these tags. When you view a metric on a graph, the default UI behavior is to use no grouping.
How many tags
You can use 16 tags per metric:
- the
0tag is usually for anenvironment(read more about customizing it), - the
1..15tags are for any other characteristics.
There is also one more String top tag:
- the
__stag.
"What if I want more tags?"
Unfortunately, it is impossible for now. We plan to increase the number of tags in the future.
Tag names
You can use system tag names (0..15) to send data. For convenience,
add aliases (custom names) to your tags.
Please use these characters:
- Latin alphabet
- integers
- underscores
Do not start tag names with underscores. They are for StatsHouse internal use only.
You can use the same tag names for different metrics.
In the StatsHouse UI, you can edit tag names and add short descriptions to them.
Tag values
Tag values are usually string values. StatsHouse maps all of them to int32 values for higher efficiency.
This huge string↔int32 map is common for all metrics, and the budget for creating new mappings is limited.
Mapping flood appears when you exceed this budget.
Length and characters
Tag values must contain only UTF-8 printable characters. All the non-printing characters are replaced with the traffic sign.
The maximum tag value length is 128 bytes—the rest is cut.
Tag values are also normalized: all leading and trailing white space is removed, as defined by Unicode. The sequence of Unicode whitespace characters within a tag value is replaced with one ASCII whitespace character.
How many tag values
There is no formal limitation for a number of tag values, but the rule is to have not that many of them.
Tags with many different values such as user IDs or email addresses may lead to mapping flood errors or increased sampling due to high cardinality. In StatsHouse, metric cardinality is how many unique tag value combinations you send for a metric.
If a tag has too many values, they will soon exceed the mapping budget and will be lost: tag values for your measurements will become the empty strings.
Even if all your tag values have been already mapped, and you avoid the mapping flood but keep sending data with many tag values, your data will probably be sampled. Sampling means that StatsHouse throws away pieces of data to reduce its overall amount. To keep aggregation, statistics, and overall graph's shape the same, StatsHouse multiplies the rest of data by a sampling coefficient.
If it is important for you not to sample data at all, keep an eye on your metric cardinality or reduce resolution for your metric.
If you need a tag with many different 32-bit integer values (such as user_ID), use the
Raw tag values to avoid the mapping flood.
For many different string values (such as search_request), use a String top tag.
Raw tags
If tag values in your metric are originally 32-bit integer values, you can mark them as Raw ones to avoid the mapping flood.
These Raw tag values will be parsed as (u)int32 (-2^31..2^32-1 values are allowed)
and inserted into the ClickHouse database as is.
To help yourself remember what your Raw tag values mean, specify a format for your data to show in the UI and add value comments.
String top tag
Use a String top tag (__s) when you need a tag with many different string values such as referrers or search
requests.
With the common tags, you will get mapping flood errors very soon for this scenario. The String top tag stands apart from the other ones as its values are not mapped to integers. Thus, you can avoid mapping flood errors and massive sampling.
The String top tag has a special storage: when you send your data labeled with the String top tag values, only the most popular tag values are stored. The other tag values for this metric become empty strings and are aggregated. Read more about the String top tag implementation.
To filter data with the String top tag on a graph, add a name or description to it.
Host name as a tag
To view statistics for each host separately, you may want to use host names as tag values. Try the Max host option instead. You do not have to send something special to get use of Max host—enable it in the UI.
Using host names as tag values prevents data from being aggregated and leads to increased sampling. By contrast, the Max host option does not lead to increased sampling but allows you to find the host that sends the maximum value for your metric.
The Max host option helps to answer questions like these:
- which host has the maximum disk space usage, or
- which host shows the maximum rate for a particular error type.
During aggregation, StatsHouse uses the special max_host column in the database to store the name of the host,
which is responsible for sending the maximum value (for value metrics) or the maximum contribution to the counter (for
counter metrics).
For example, StatsHouse aggregates the rows from two agents:
| timestamp | metric | format | … | min | max | max_host |
|---|---|---|---|---|---|---|
| 13:45:05 | toy_latency | JSON | 200 | 1200 | nginx001 |
and
| timestamp | metric | format | … | min | max | max_host |
|---|---|---|---|---|---|---|
| 13:45:05 | toy_latency | JSON | 4 | 80 | nginx003 |
The maximum toy_latency value (which is 1200) is associated with the nginx001 host in the resulting aggregate:
| timestamp | metric | format | … | min | max | max_host |
|---|---|---|---|---|---|---|
| 13:45:05 | toy_latency | JSON | 4 | 1200 | nginx001 |
Implementation details
The value in the max_host column is float32 rather than float64 for better compression as there is no
need for high precision here. The host name is stored as the string↔int32 mapping similar to tag values.
We also recommend using the environment tag (or similar) instead of host_name. When you deploy an experimental feature
to one or more hosts, label them with the staging or development tag values instead of their host names.
Customizing the environment tag
StatsHouse stores metrics in a ClickHouse database,
where 16 columns are for tags. These tag columns are named like 1..15. For example, the tag names may be “format”
and “status.” One can edit the metric, so that "format" relates to the 1 column,
and "status" relates to the 2 column. You can use system names 1..15.
What about the 0 column? Use it to specify environments for collecting statistics, e.g., production or staging.
For example, if the experimental version of software is installed on a number of hosts, you can associate the 0 tag
with this experiment. Set up this tag once in the client library during initialization. In other respects, the 0
tag is similar to the other ones.
Timestamps
StatsHouse writes real-time data as a priority.
Writing historical data is allowed only for the latest hour and a half.
If the timestamp is in the future, StatsHouse replaces it with the current time.
If the timestamp relates to a moment that is more than 1.5 hours ago, StatsHouse replaces it with the current time minus 1.5 hours.
For cron jobs that send metric data, use the one-hour sending period:
it is OK to send data once in an hour, but it is not OK to send data once in a day.
We do not encourage you to specify timestamps explicitly because rows with differing timestamps cannot be aggregated—this may lead to increased sampling. Moreover, the ClickHouse database is rather slow when inserting historical data.