Edit a metric
Learn how to edit a metric and what the editing options are:
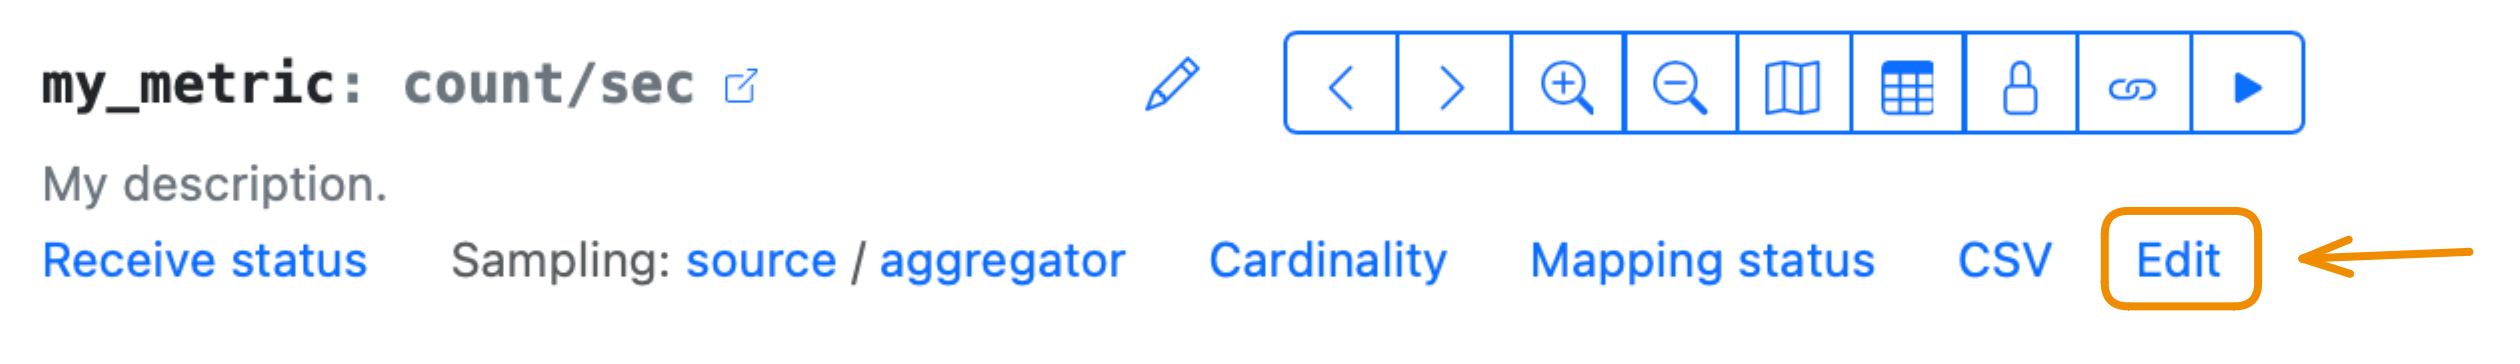
How to edit a metric
If you have started sending metric data, you have already set up the essential metric characteristics. With the editing options, try more settings or change the look of your metric in the UI:
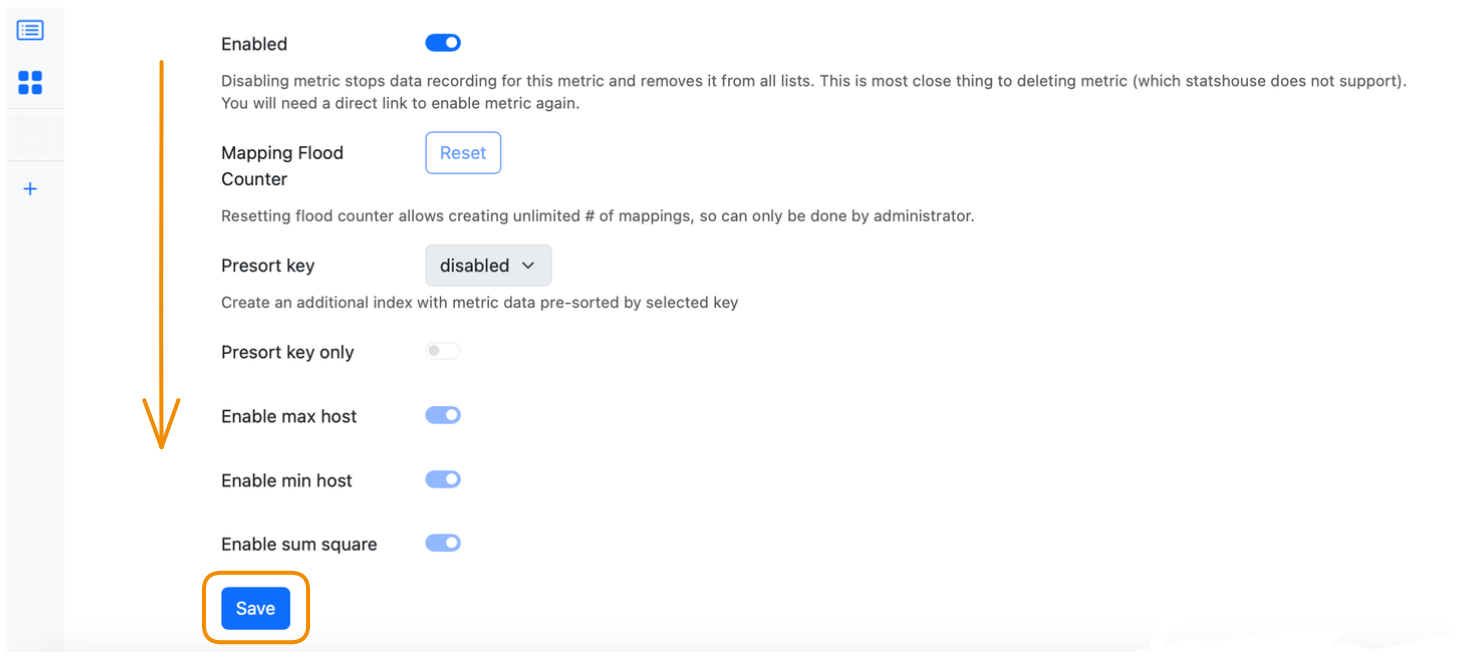
As soon as you have set up the necessary options, scroll down to the bottom of the page to save your settings:
Then scroll back to the top of the page to view your metric with the changes applied:
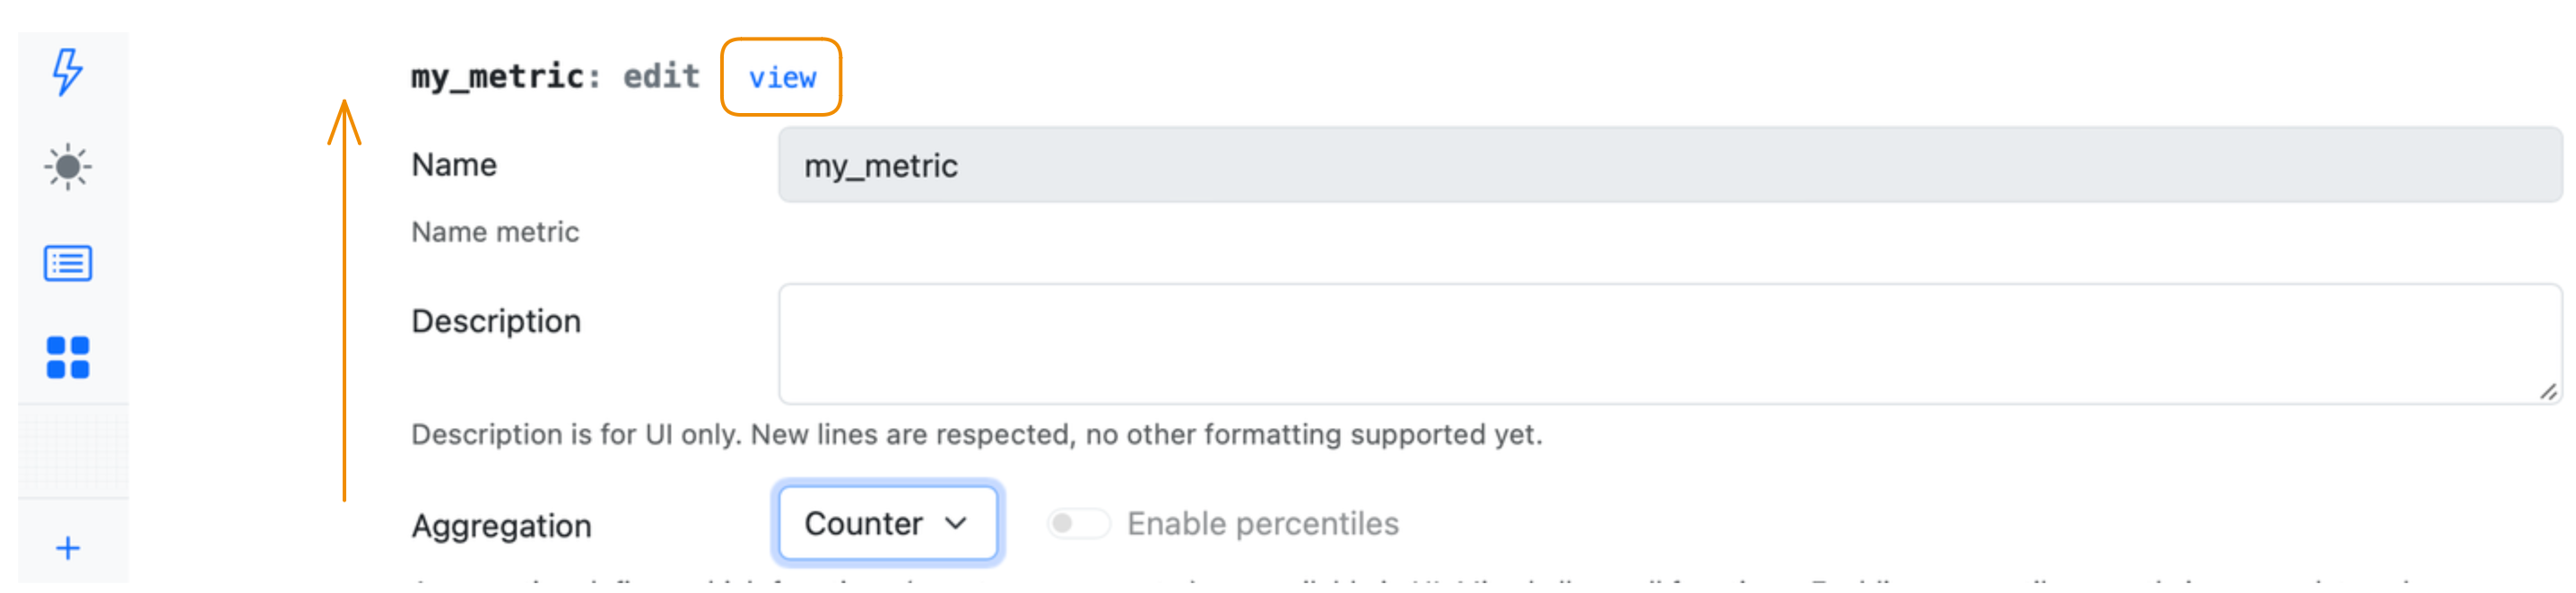
Description
Add a metric description on one or multiple lines to show in the UI. Feel free to use the standard Markdown formatting for descriptions.
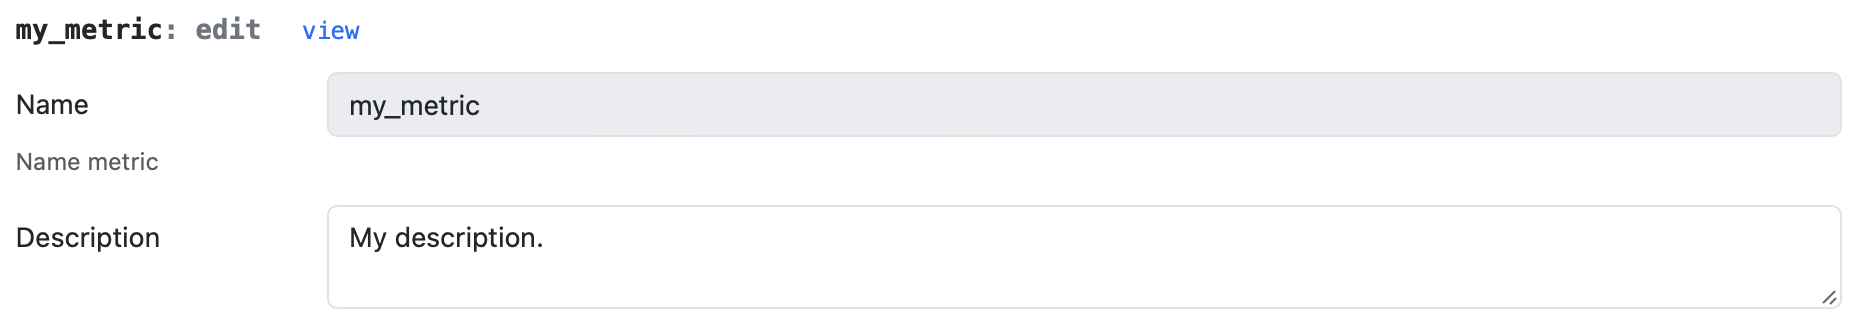
You can edit the graph name or description to customize the look of the dashboard or the graph view without changing the name of the metric itself. You cannot rename a metric.
Aggregation
Basically, a metric type affects the range of descriptive statistics that are meaningful for a metric. In the Descriptive statistics dropdown menu, you can see statistics, which may be not relevant for your metric type. If you pick them, you will see 0 values for them on a graph. For example, you cannot view the cumulative graph for unique metrics.
To switch off showing irrelevant statistics in the UI, specify the type of your metric:
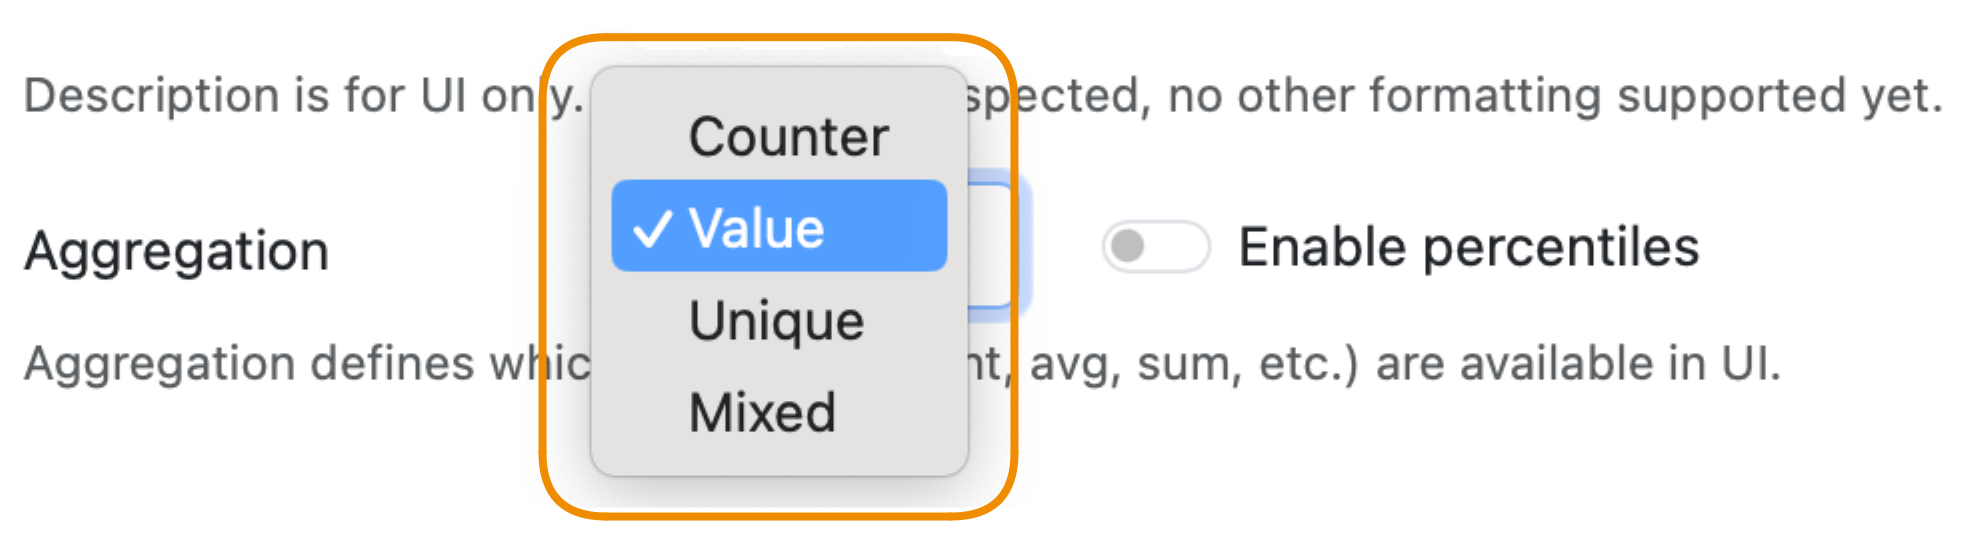
The Mixed type allows you to display all the statistics (even irrelevant ones) in the UI. See more on changing or combining metric types.
Percentiles
Percentiles are available for value metrics only:
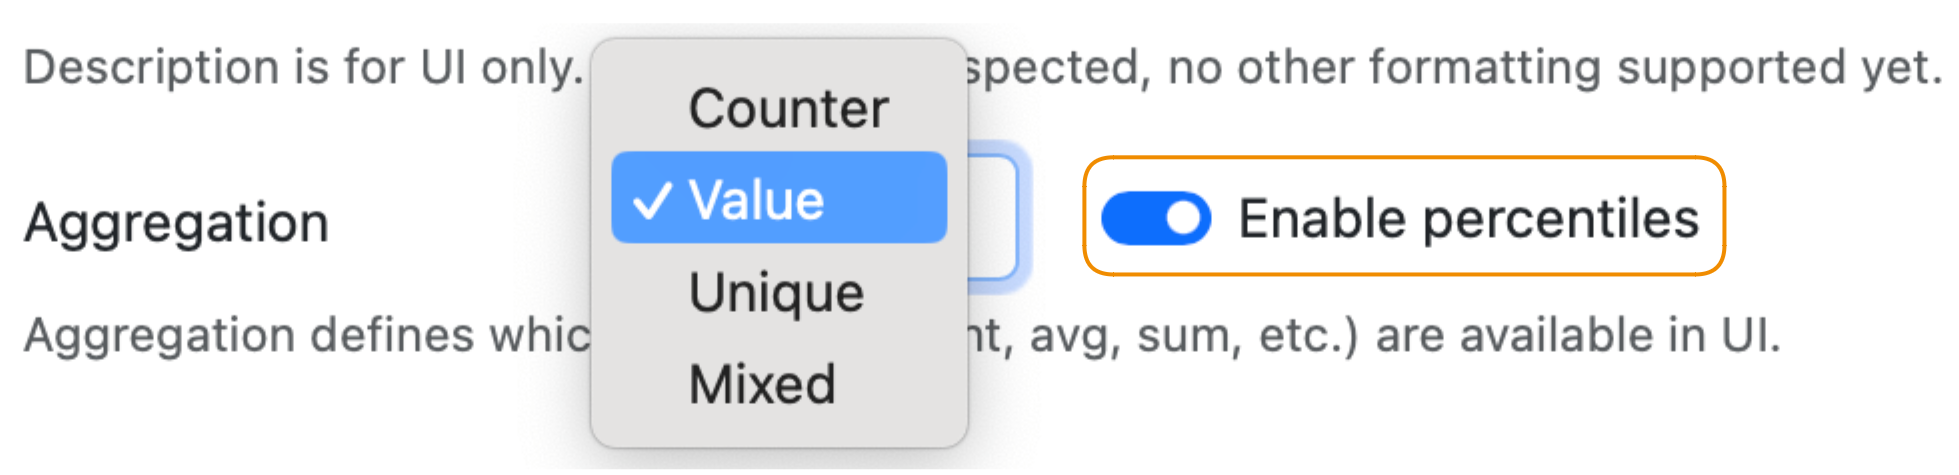
You start writing percentiles for a metric only upon switching the Enable percentiles toggle on. You will not see percentiles for the previously written data.
Note that the amount of data increases for a metric with percentiles, so enabling them may lead to increased sampling. If it is important for you to have the lower sampling factor, keep an eye on your metric cardinality or choose custom resolution for writing metric data.
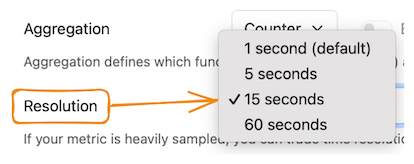
Resolution
The highest available resolution of data to show on a graph depends on the currently available aggregate:
- per-second aggregated data is stored for the first two days,
- per-minute aggregated data is stored for a month,
- per-hour aggregated data is available forever.
So, you can get per-second data for the last two days, per-minute data for the last month, and you can get per-hour data for any period you want.
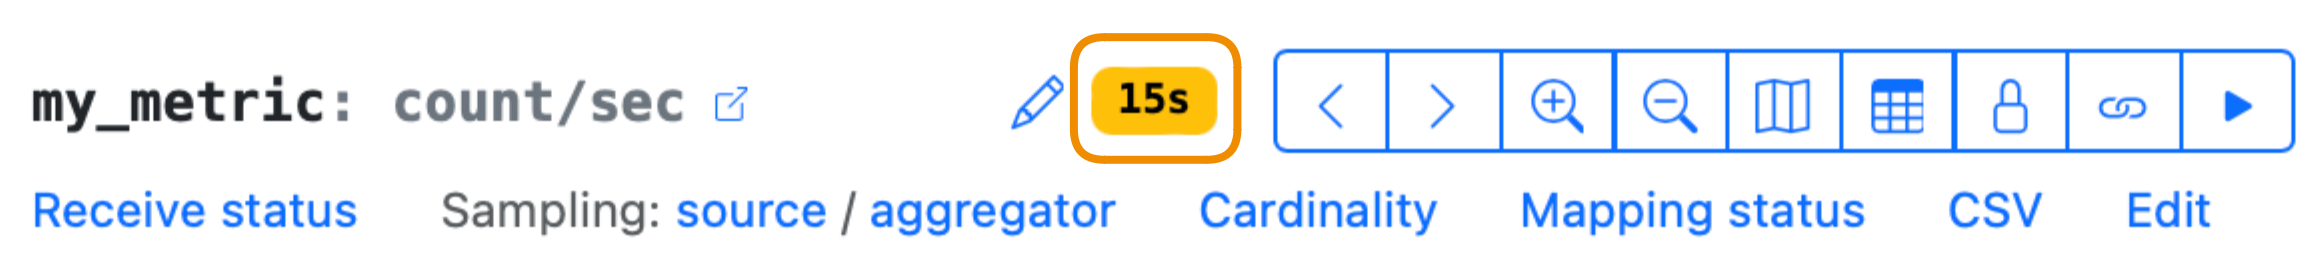
If getting the highest available resolution is not crucial for you, but it is important for you to reduce sampling, reduce your metric resolution. For example, choose a custom resolution to make the agent send data once per 15 seconds instead of sending per-second data:
You see custom resolution near the metric name in a graph view:
Setting up resolution affects processing data—not showing data in the UI. For a metric with custom resolution, it is impossible to display data on a graph with the smaller aggregation interval: you cannot show per-second data if the resolution is set to 5 seconds.
See more about metric resolution.
Unit
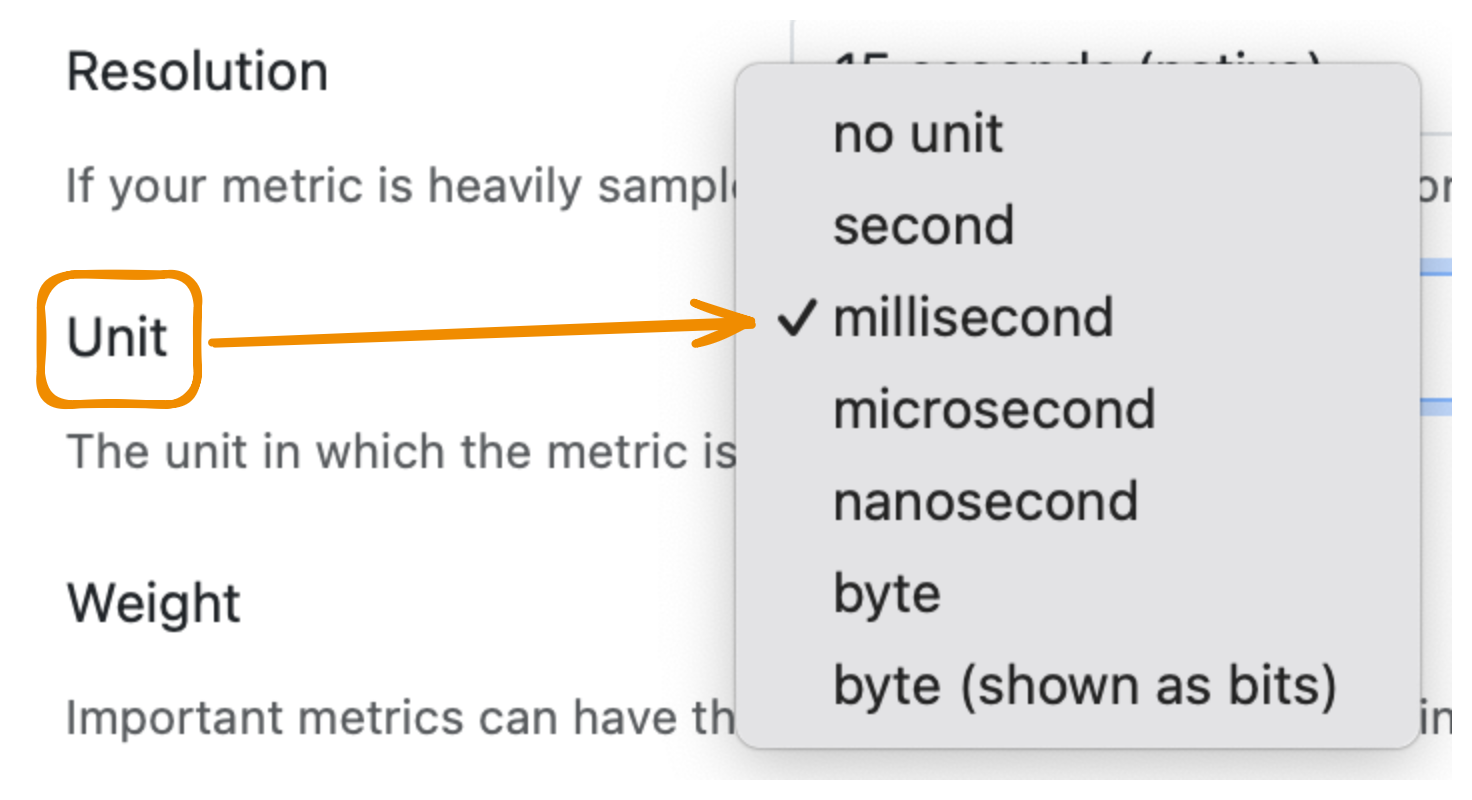
Set up measurement units for the value metric data you send to StatsHouse. With this unit information, StatsHouse generates the Y-axis label for a graph.
For example, if you set up milliseconds for your metric, you can see seconds, minutes, or even days as the Y-axis label on the graph:
Please note that the «byte (shown as bits)» option means that you send bytes to StatsHouse, but they are converted to bits to appear on the Y-axis in the UI. It may be useful for those who work with network metrics.
If you have a counter metric or view the count and count/sec statistics, you should not set a particular unit. A counter means the "number of times," so choose the no unit option.
Tags
Customize your metric tags: their look in the UI, and their behavior while sending data.
Hide the unnecessary tags
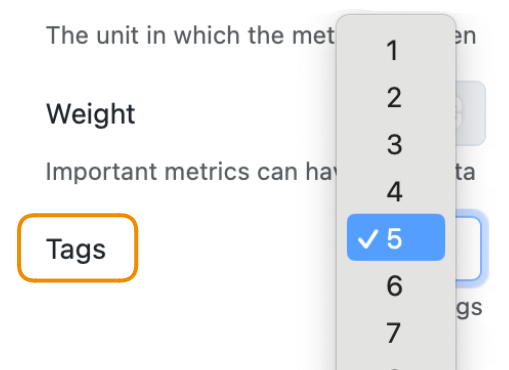
Hide the unnecessary tags in the UI if you have less than 16 tags for your metric:
To hide only one tag in the middle, enter a hyphen (-) in the Tag description field:

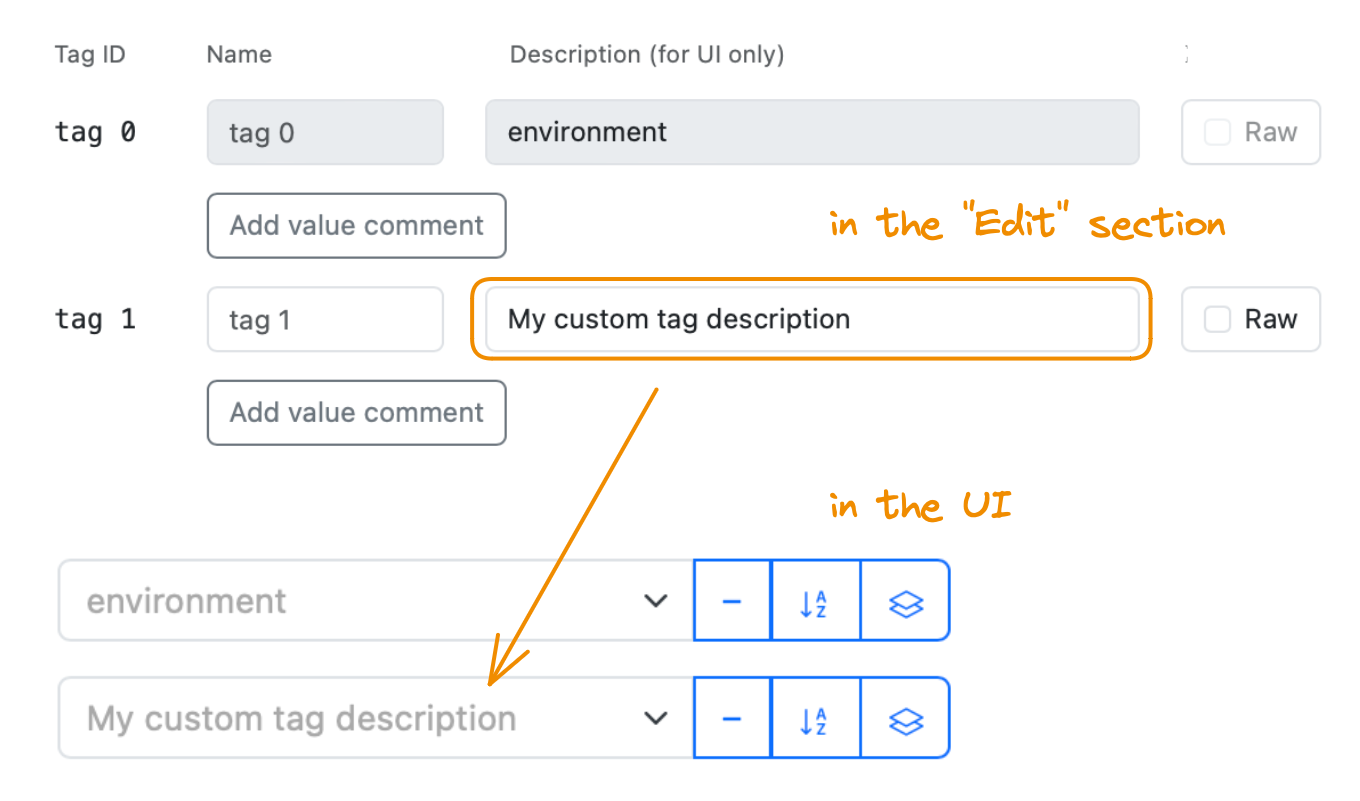
Describe tags
While sending data, you refer to a tag by its ID or a name. Before you start referring to a tag by the custom name in your sending requests, specify these names here, in the UI:
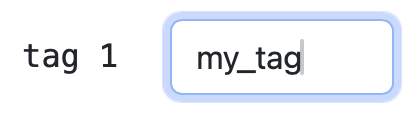
Add tag descriptions to show in the UI:
Set up Raw tags
If you need a tag with many different 32-bit integer values (such as user_ID), use the
Raw tag values to avoid the
mapping flood.
To help yourself remember what they mean, specify a format for your data to show in the UI and add value comments.
Value comments
Add value comments to remember what your raw tag values mean:
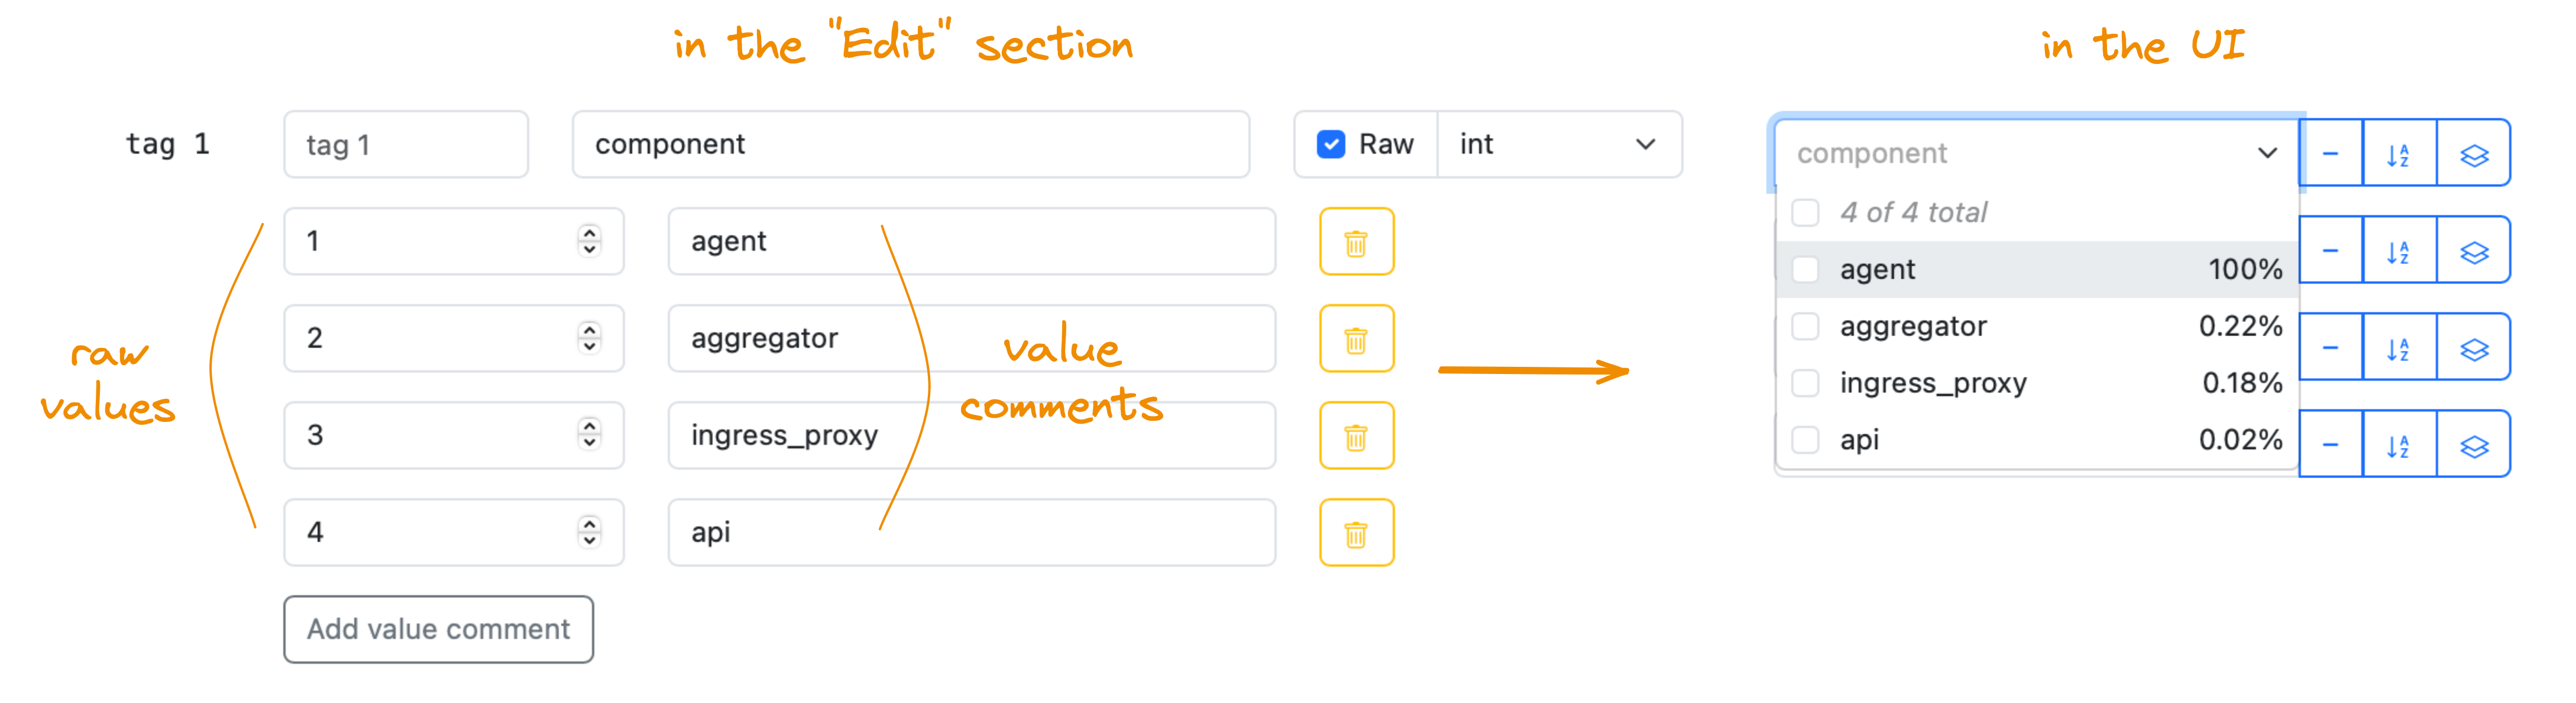
Value comments are stored as meta-information, so they do not expend the mapping budget.
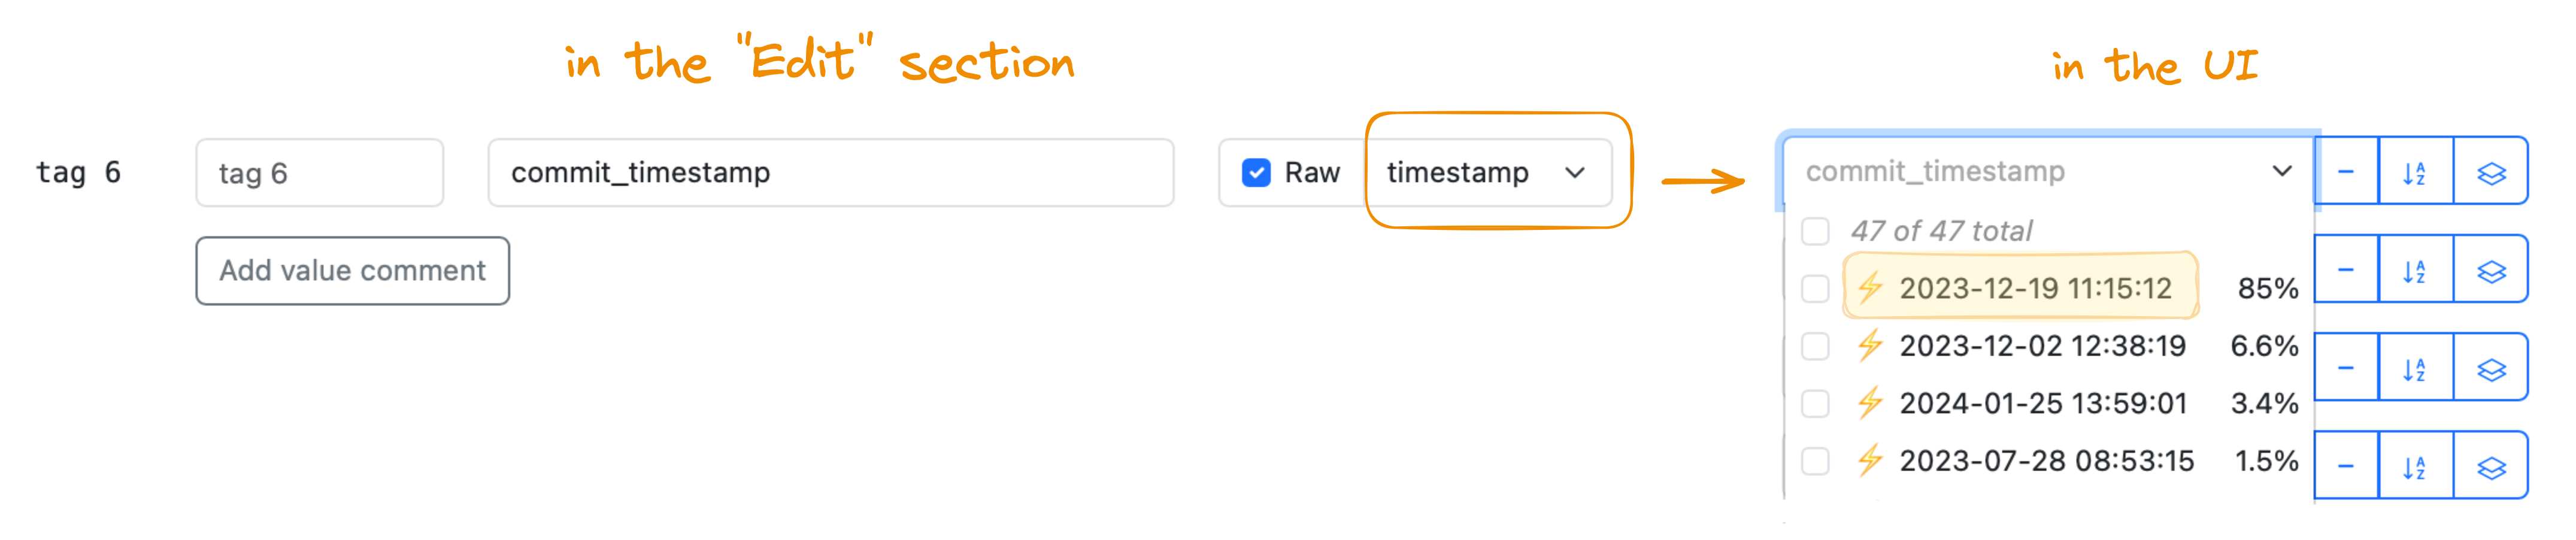
Specifying formats for raw tag values
When you send tag values as raw ones, you send 32-bit integer values. For example, you send integers that are timestamps. To make such raw tag values more readable in the UI, choose the format for them:
Please note that you send only 32-bit integer values as raw tag values. If you send IP-addresses, they look like
1062731276 but not 63.87.254.12 as the latter would be a string. When you choose an ip option as the format,
StatsHouse displays your 1062731276 raw tag value as 63.87.254.12 in the UI.
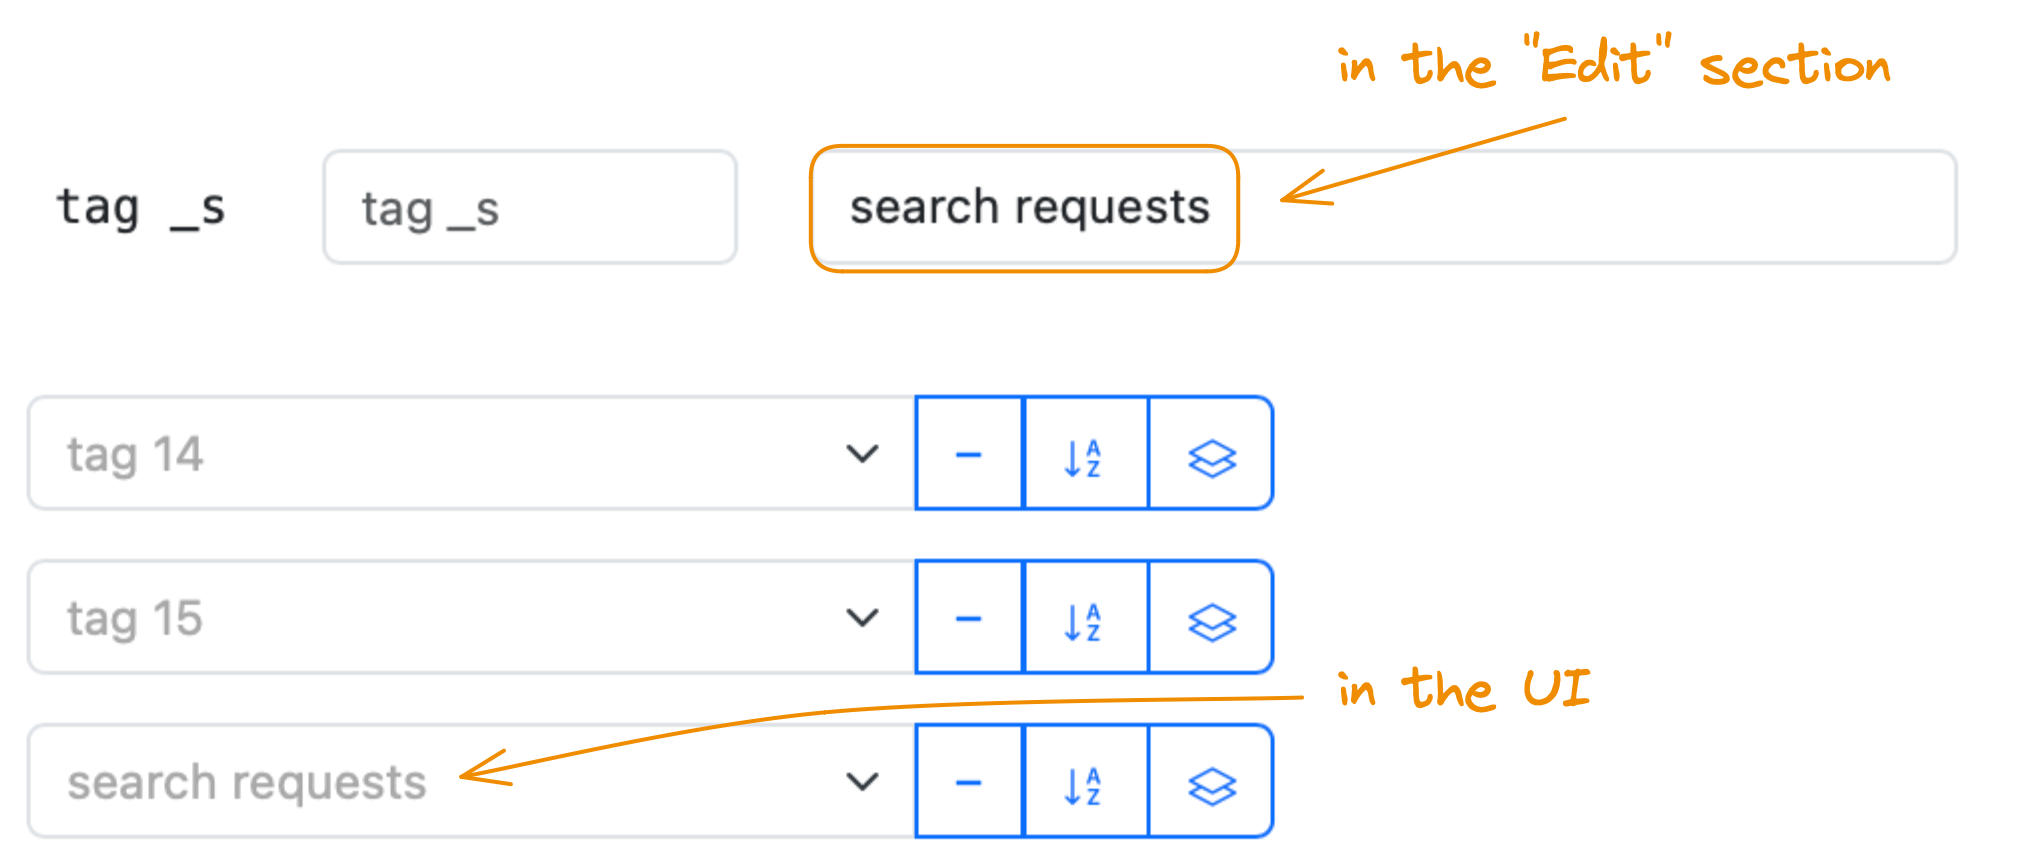
Set up String top tag
To filter data with the String top tag on a graph, add a name or description to it:
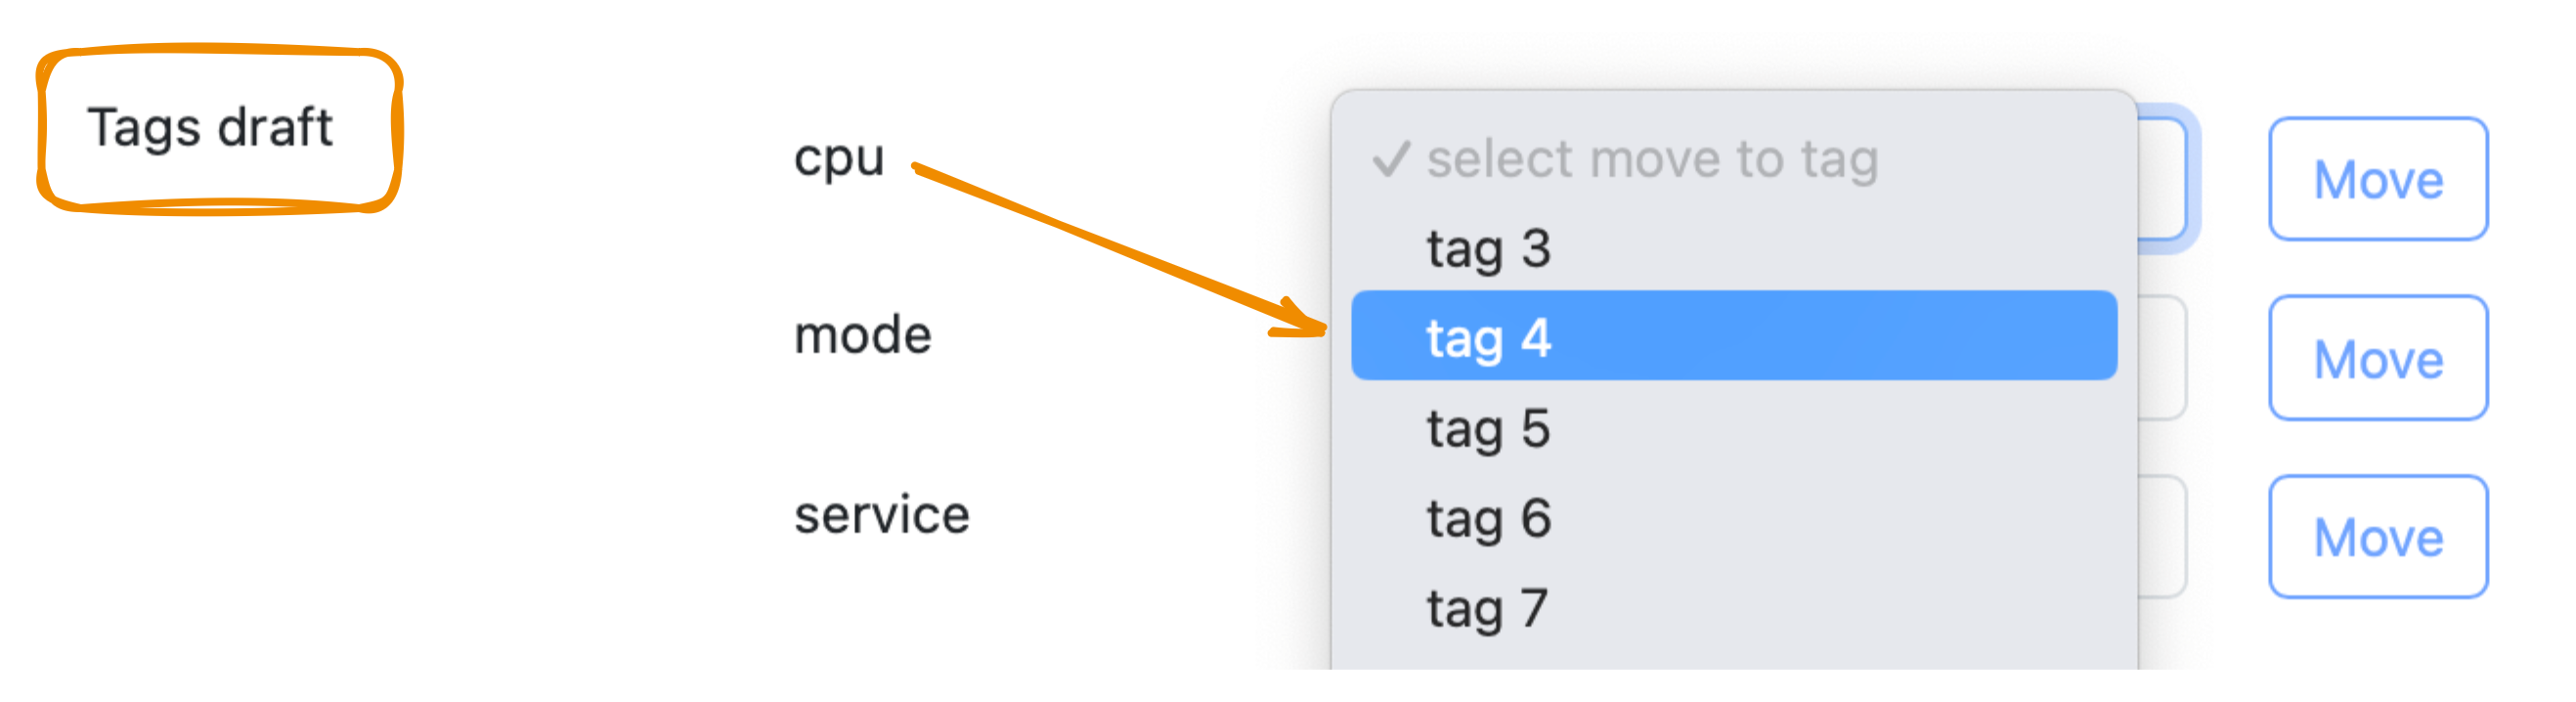
Map the draft tag names to the tag IDs
Draft tags appear when the data you send contains the tag names, but these names were not mapped to tag IDs, so they are "unknown" to StatsHouse.
The feature was implemented to support migrating from Prometheus. There may be more than 16 tags in the scraped metrics, and StatsHouse cannot map them to the tag IDs randomly.
StatsHouse extracts the "unknown" tag names from the scraped metric data and shows them as the draft tags. Users can map these draft tag names with the tag IDs manually:
Draft tags also appear when you refer to the tags in your code by the custom names, but you have not previously specified these names in the UI. See more about describing tags. The draft tag feature may help you to configure metric tags faster.
Learn more about designing tags for your metrics.
Disabling a metric
You cannot delete a metric, but you can disable it:

Disabling a metric stops writing data for it and removes it from the metric list.
To enable a metric again, you need a direct link to it.
Admin settings
These settings are for administrators only:
- Weight
- Mapping Flood Counter
- Presort key
- Presort key only
- Enable max host
- Enable min host
- Enable sum square
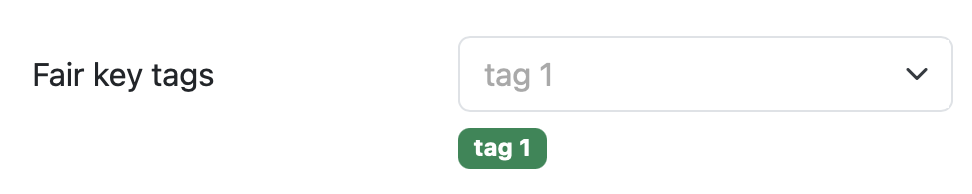
Fair key tags
Choose the tag to enable the tag-level budgeting for it: