Create and view dashboards
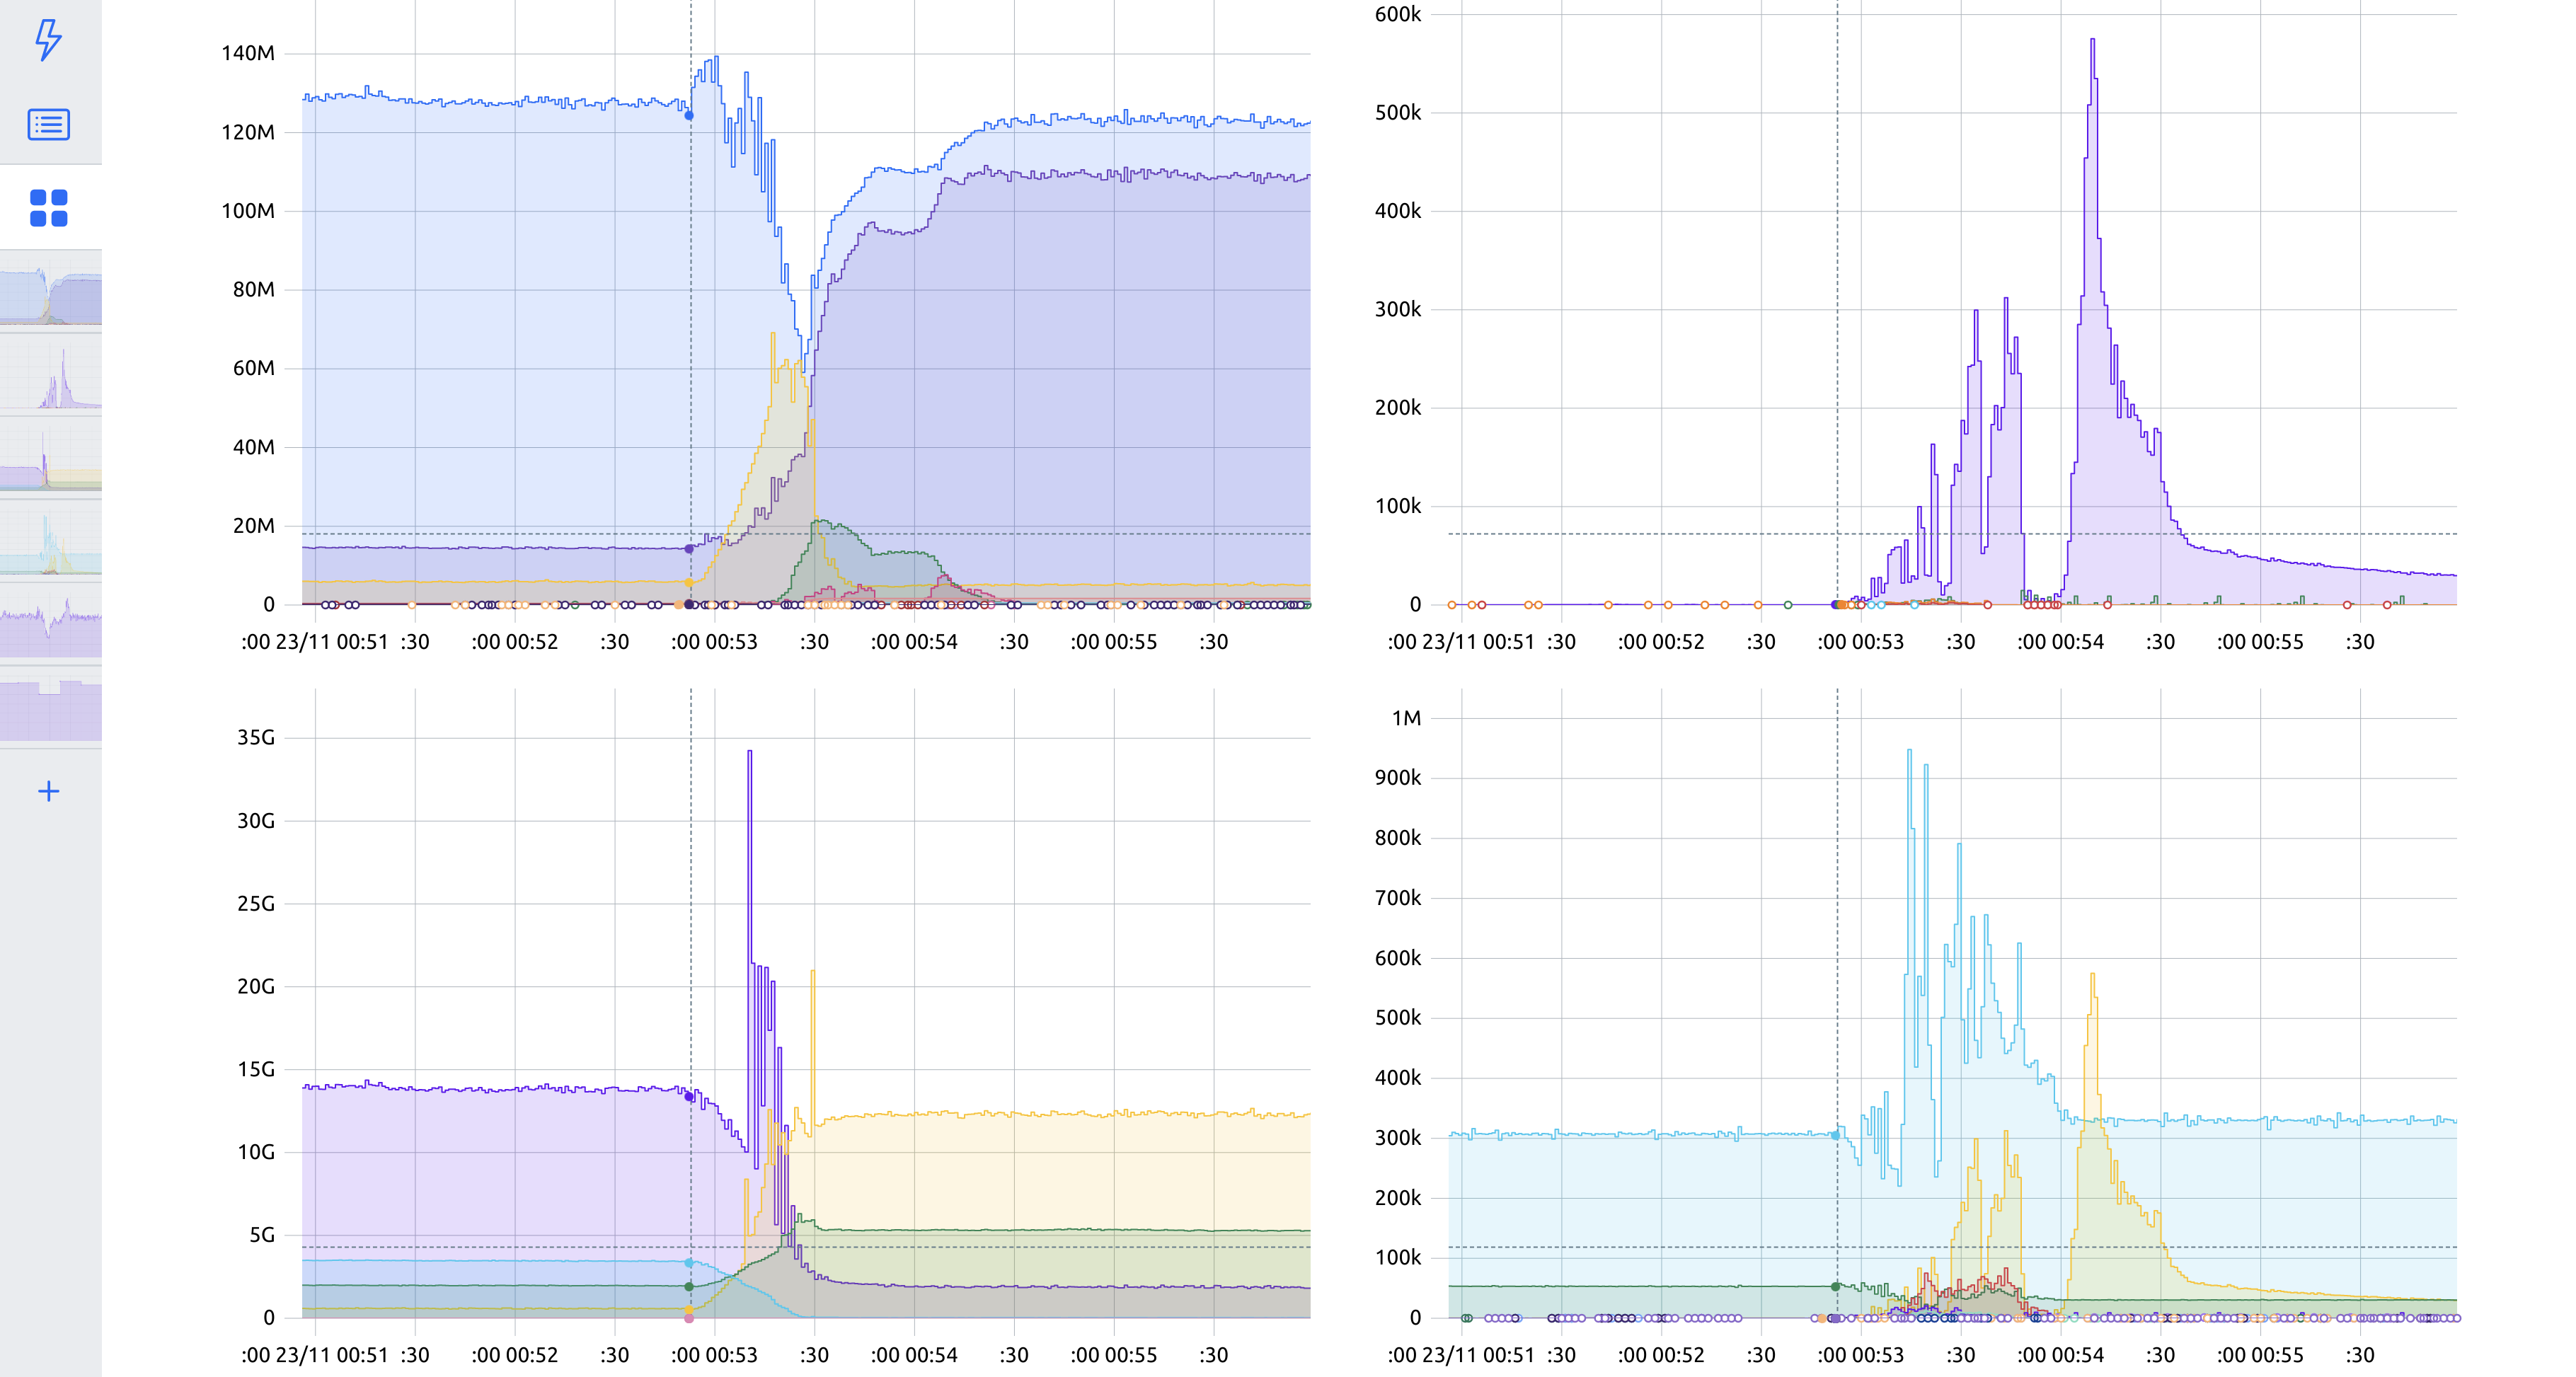
A dashboard is a graphical report of data relevant to a particular system (a product or a service):
In this section, you will find information on how to:
- Refer to existing dashboards
- Create a dashboard
- Edit a dashboard
- View a dashboard
- Remove a dashboard
- Set up PromQL-based dashboards
Refer to existing dashboards
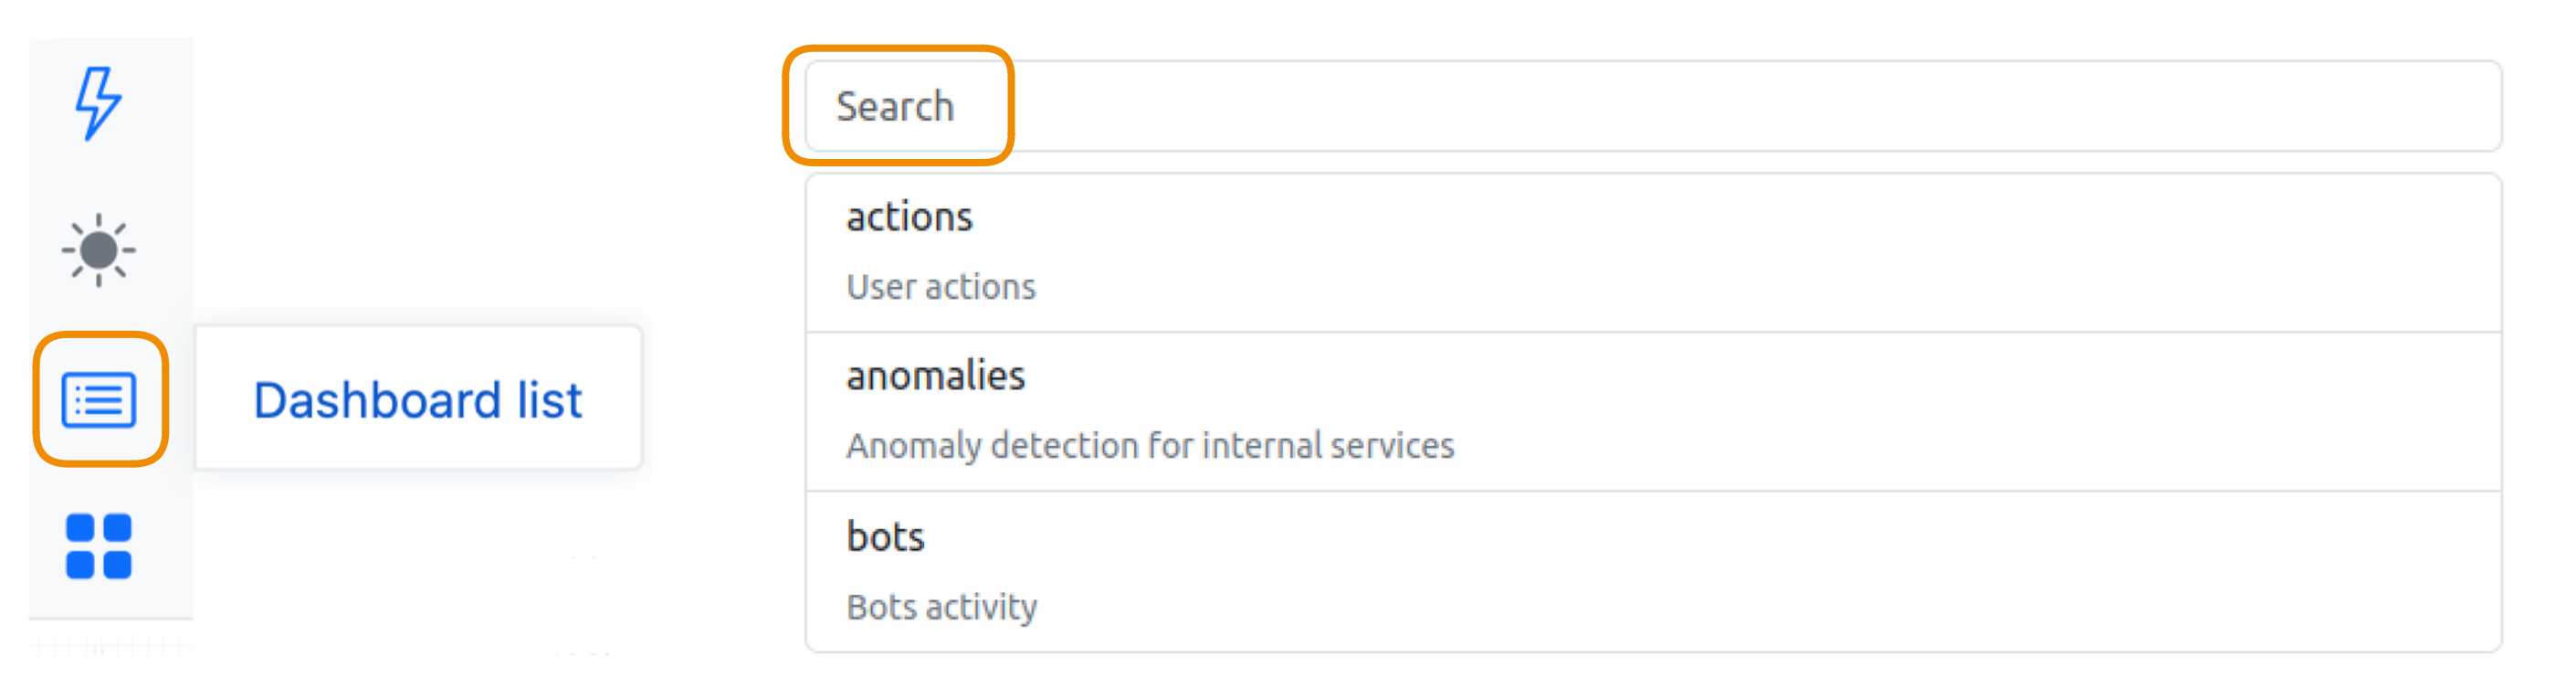
Choose an existing dashboard from a list:
Mark dashboards as favorites
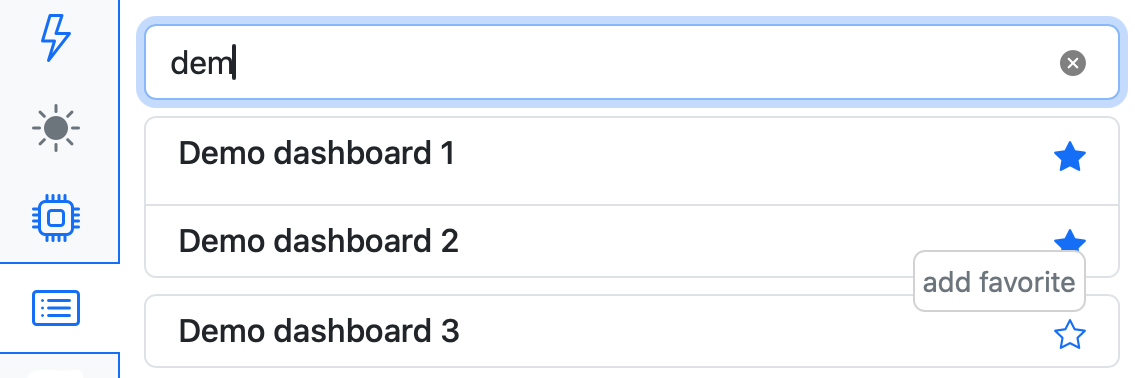
Mark the frequently used dashboards as favorites — click on the "star" next to the dashboard name:
You can also add metrics to your list of favorites.
Create a dashboard
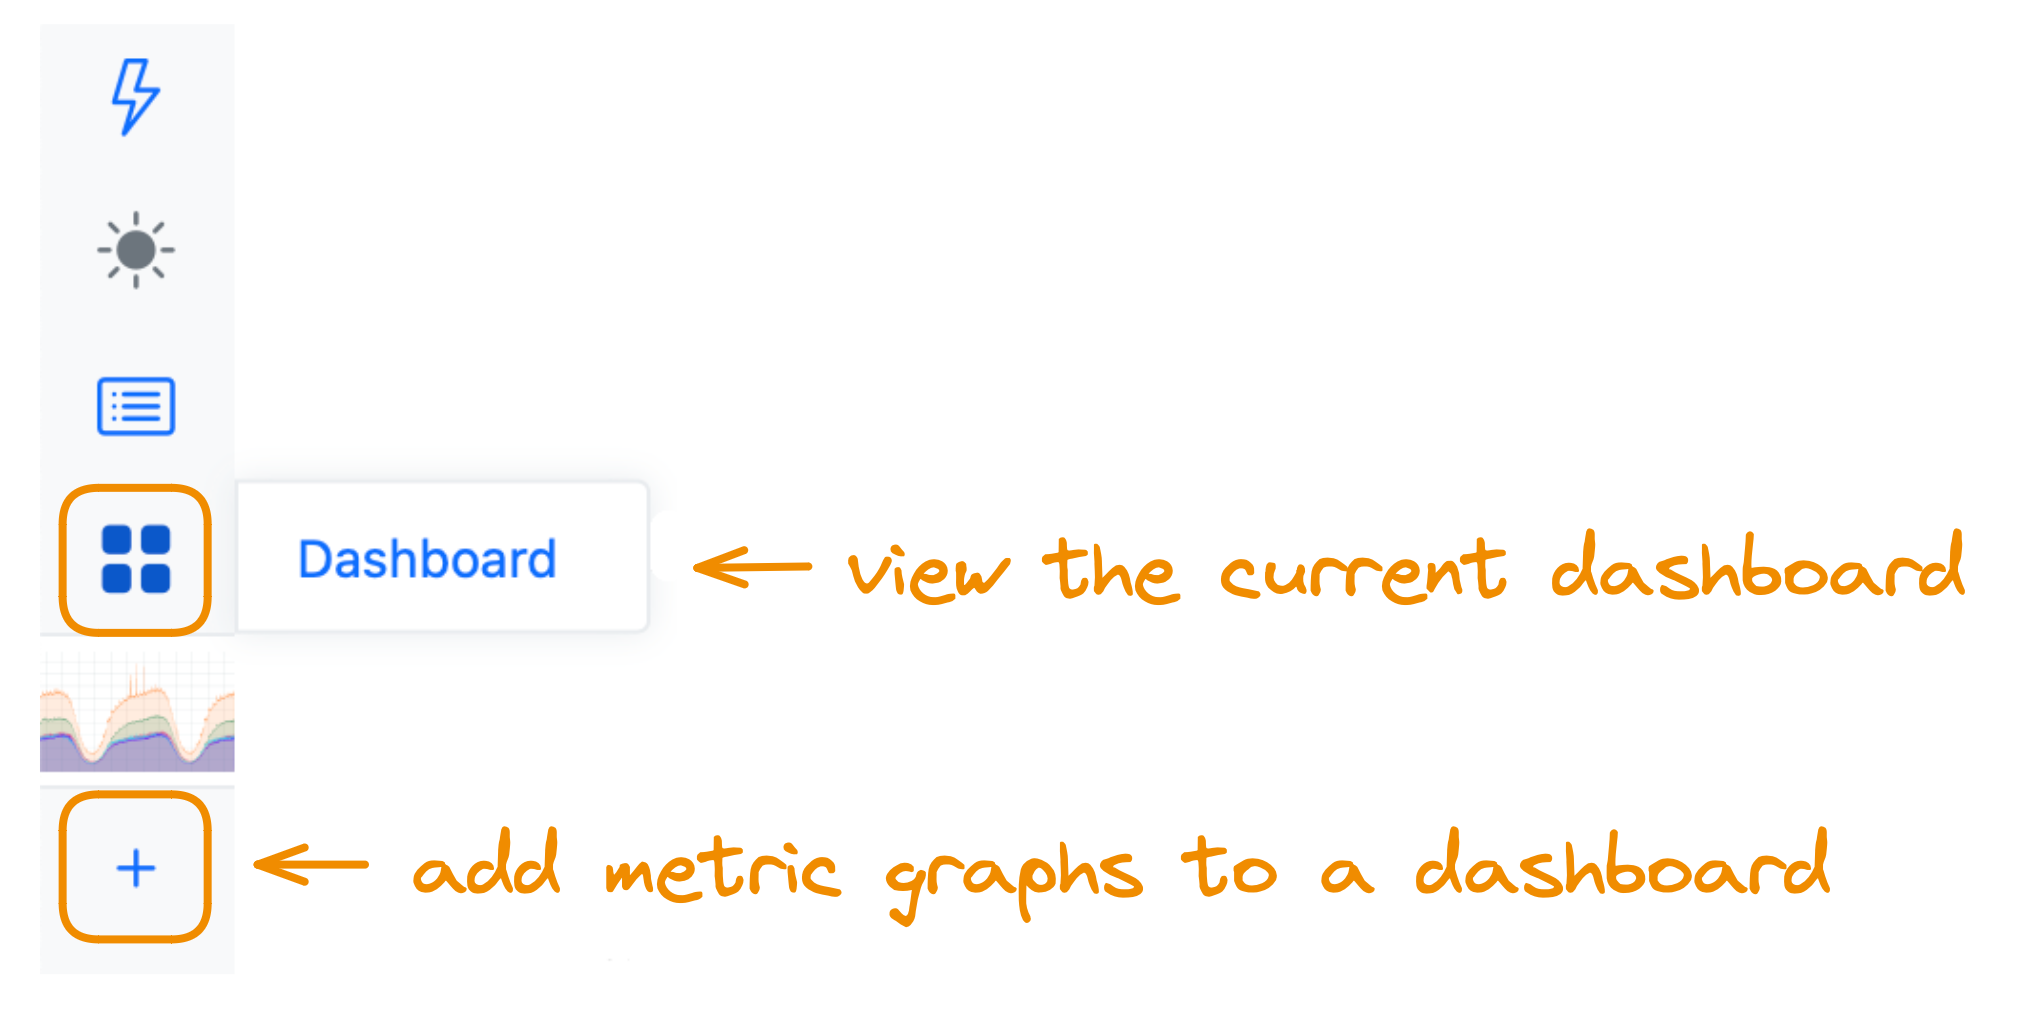
StatsHouse opens a dashboard for a currently viewed metric graph automatically. To add more graphs on a dashboard, create a new metric tab and choose the other necessary metric:
To finish creating the dashboard, add a name and description to it so that it appears in the dashboard list.
Edit a dashboard
Edit a dashboard to customize its name, description, layout, and behavior—press the button with the "gear" icon:

Upon editing, please remember to save your changes.
Settings
In the Setting section, set up the key dashboard characteristics, such as general info or variables.
Dashboard info
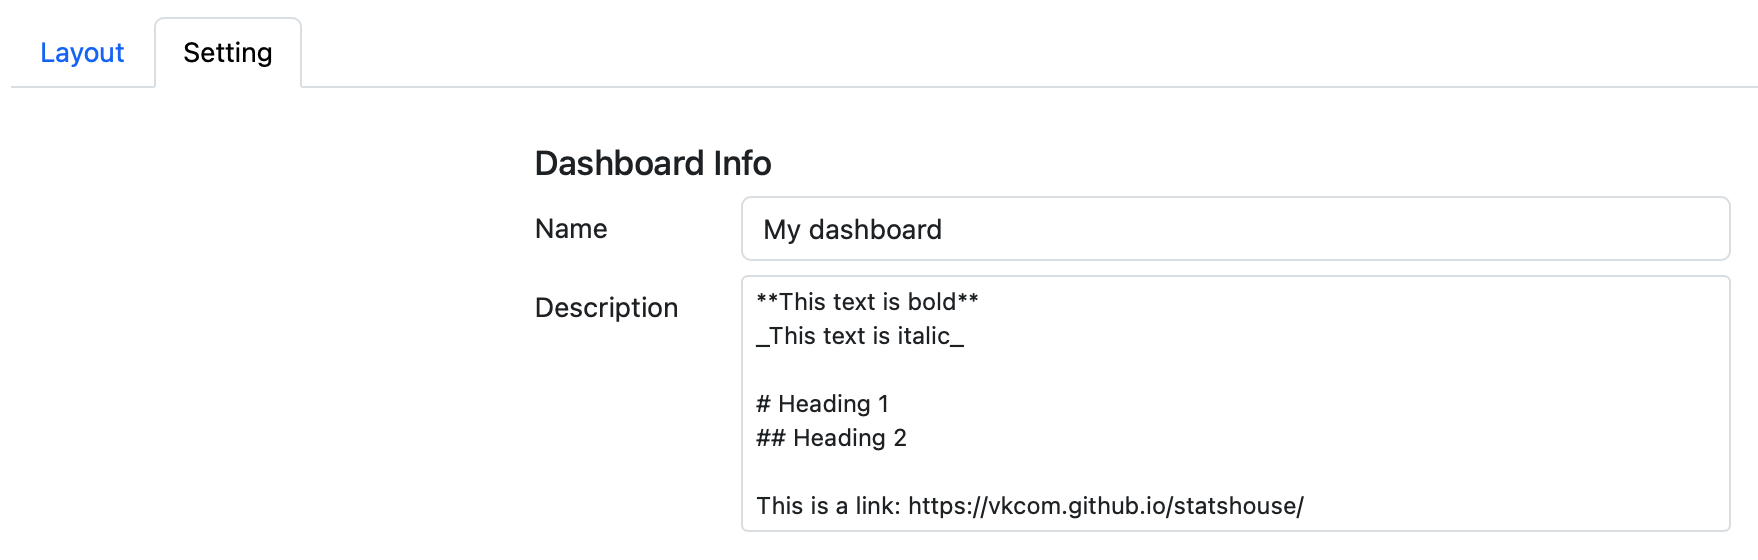
Go to the Setting section to set up a name and description for your dashboard:
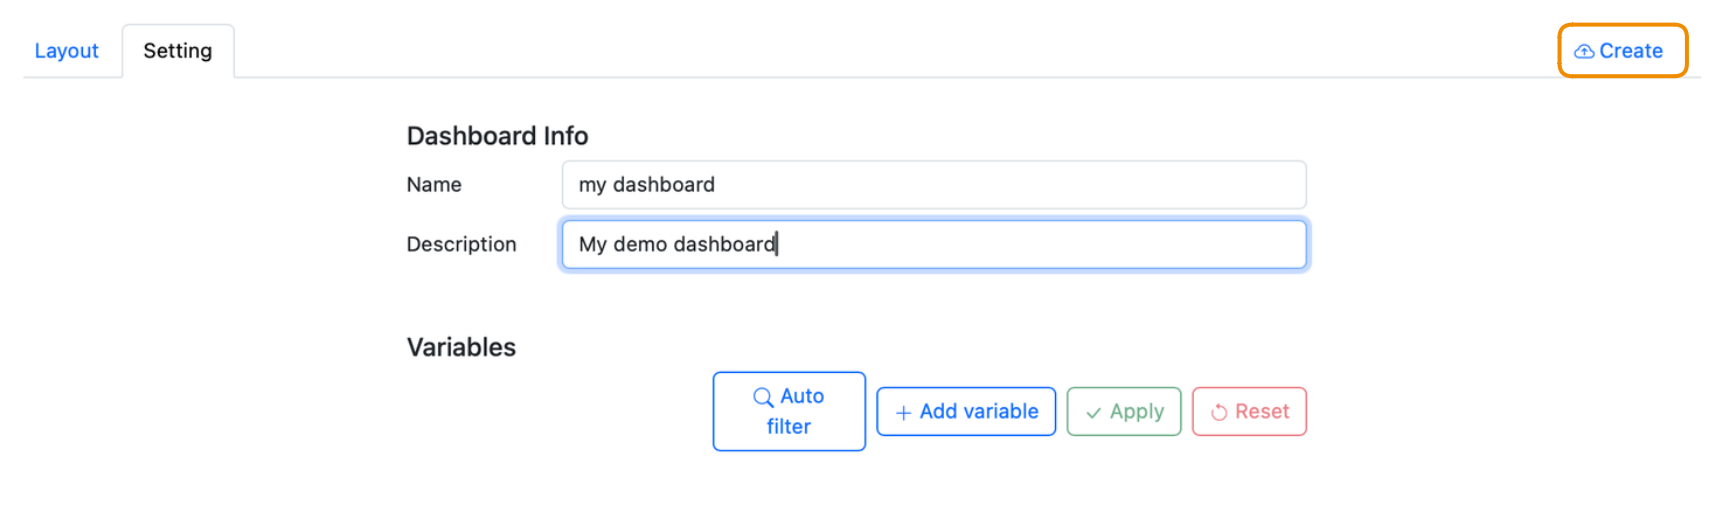
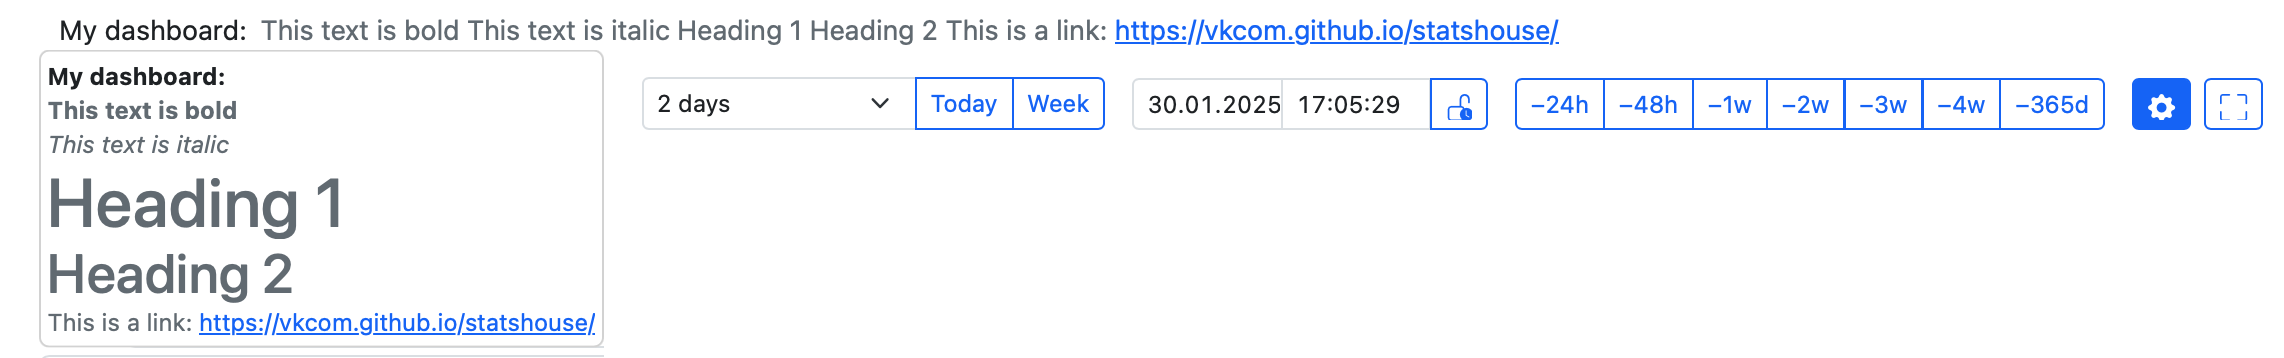
Feel free to use the standard Markdown formatting for descriptions.
Please note that formatting appears only upon hovering over descriptions (in the "tooltip" descriptions).
To finish creating the dashboard, press the Create button. The button becomes active only when you add a dashboard name.
Please note that you cannot reuse the name of the removed dashboard.
Variables
With variables, you can apply the same tag filters to several metrics simultaneously.
A variable binds the tags of two metrics together even if the sets of values for the tags do not
intersect. It is also useful if the same tag has different names such as production or prod in different metrics.
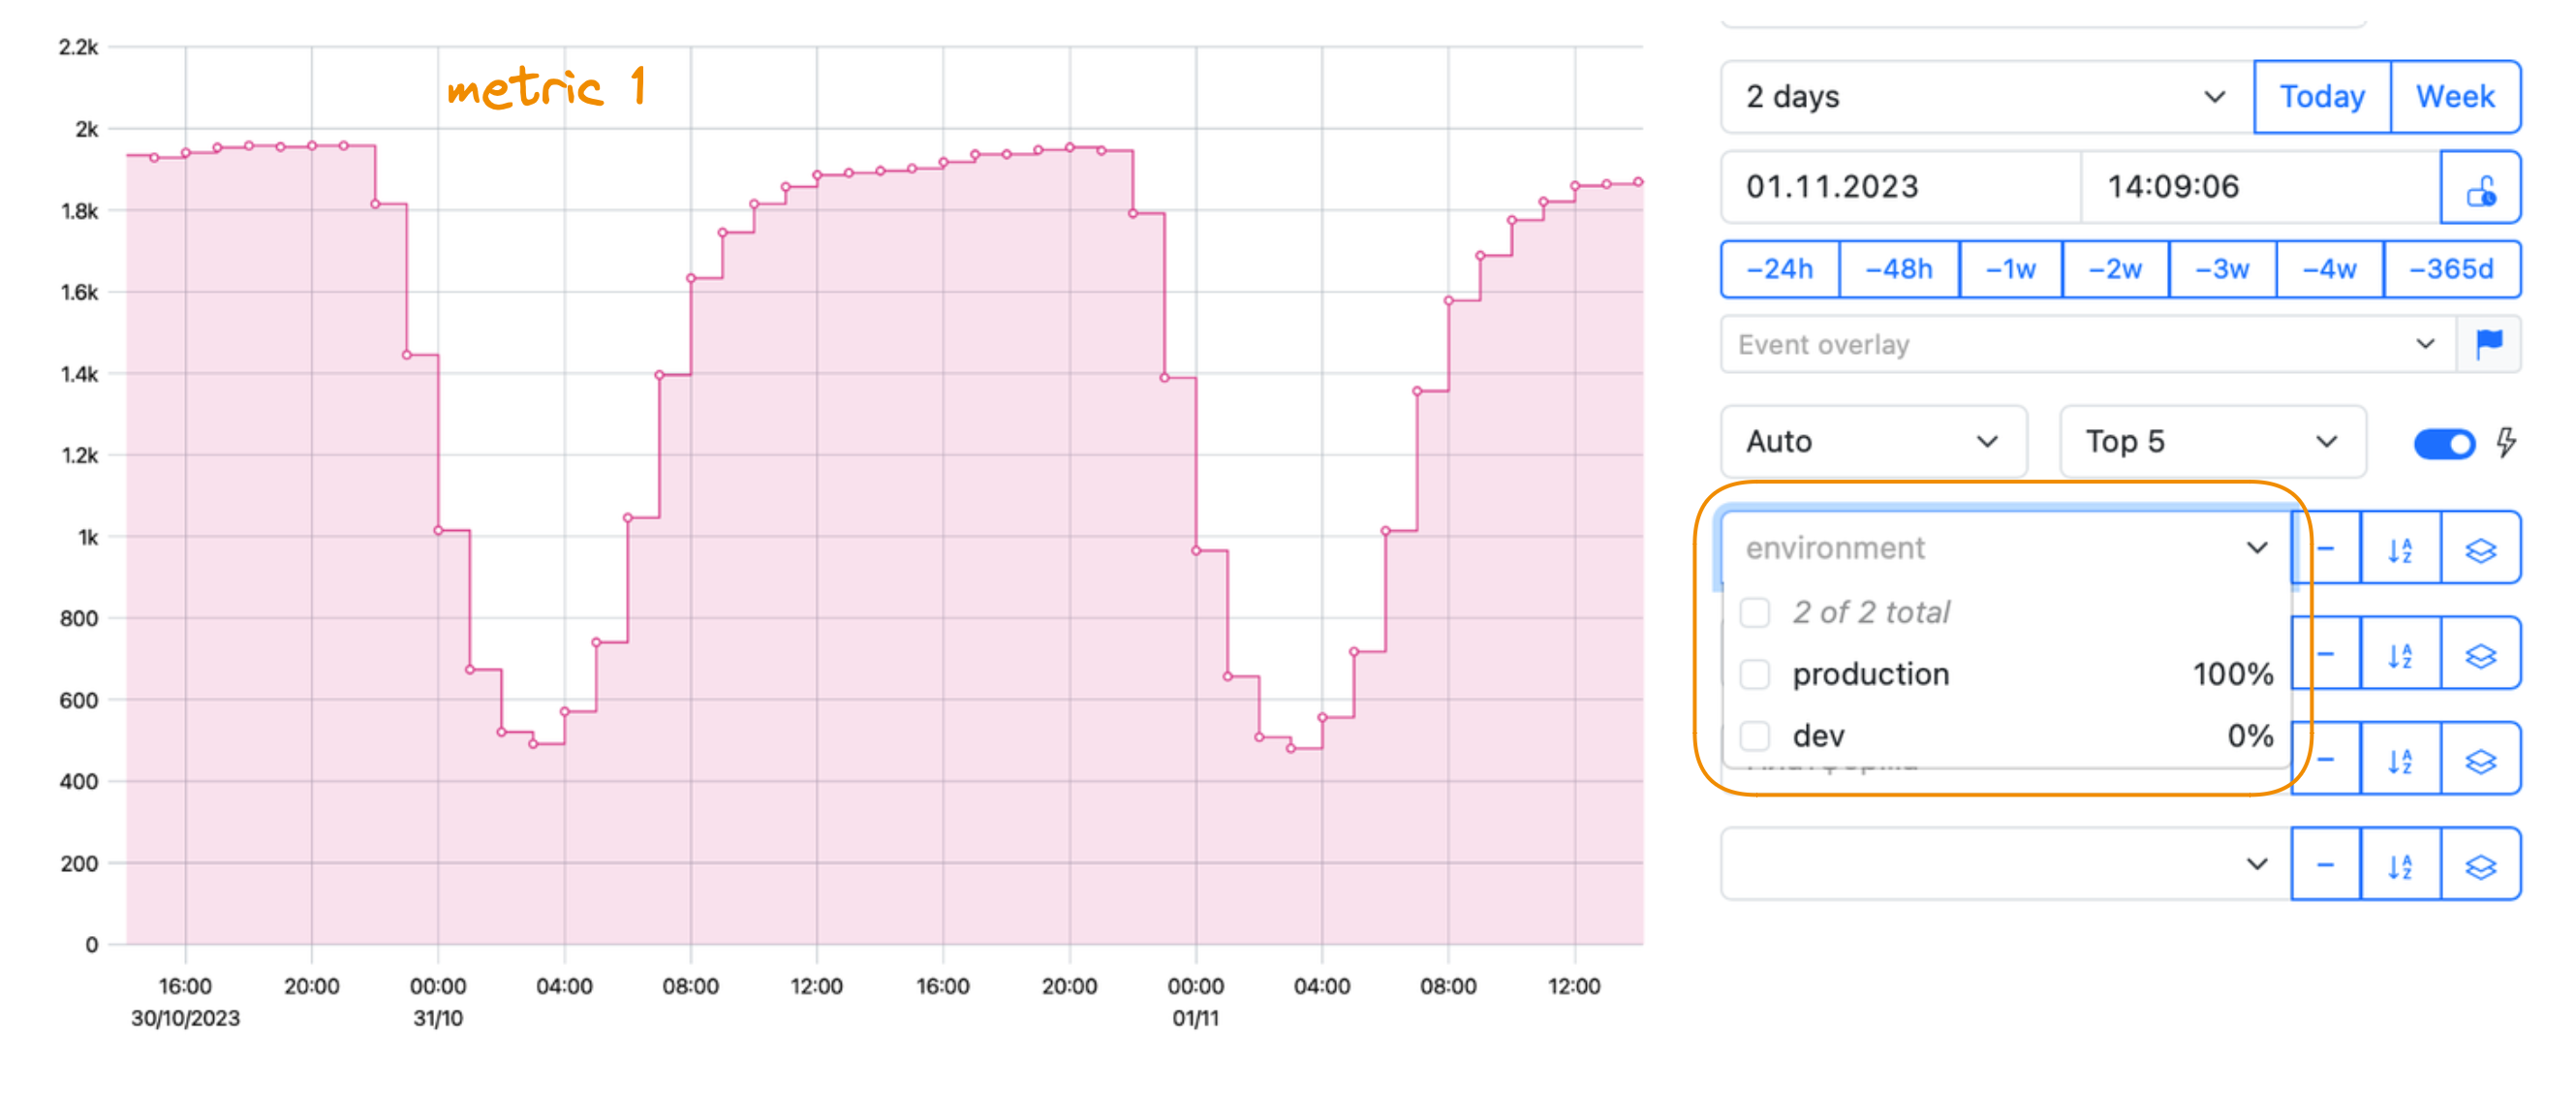
Imagine you want to view two metrics on a dashboard. Each metric has the environment tag. What if you would like to
bind these tags together to filter data for both metrics simultaneously?
The first metric's environment tag has two values (production, dev):
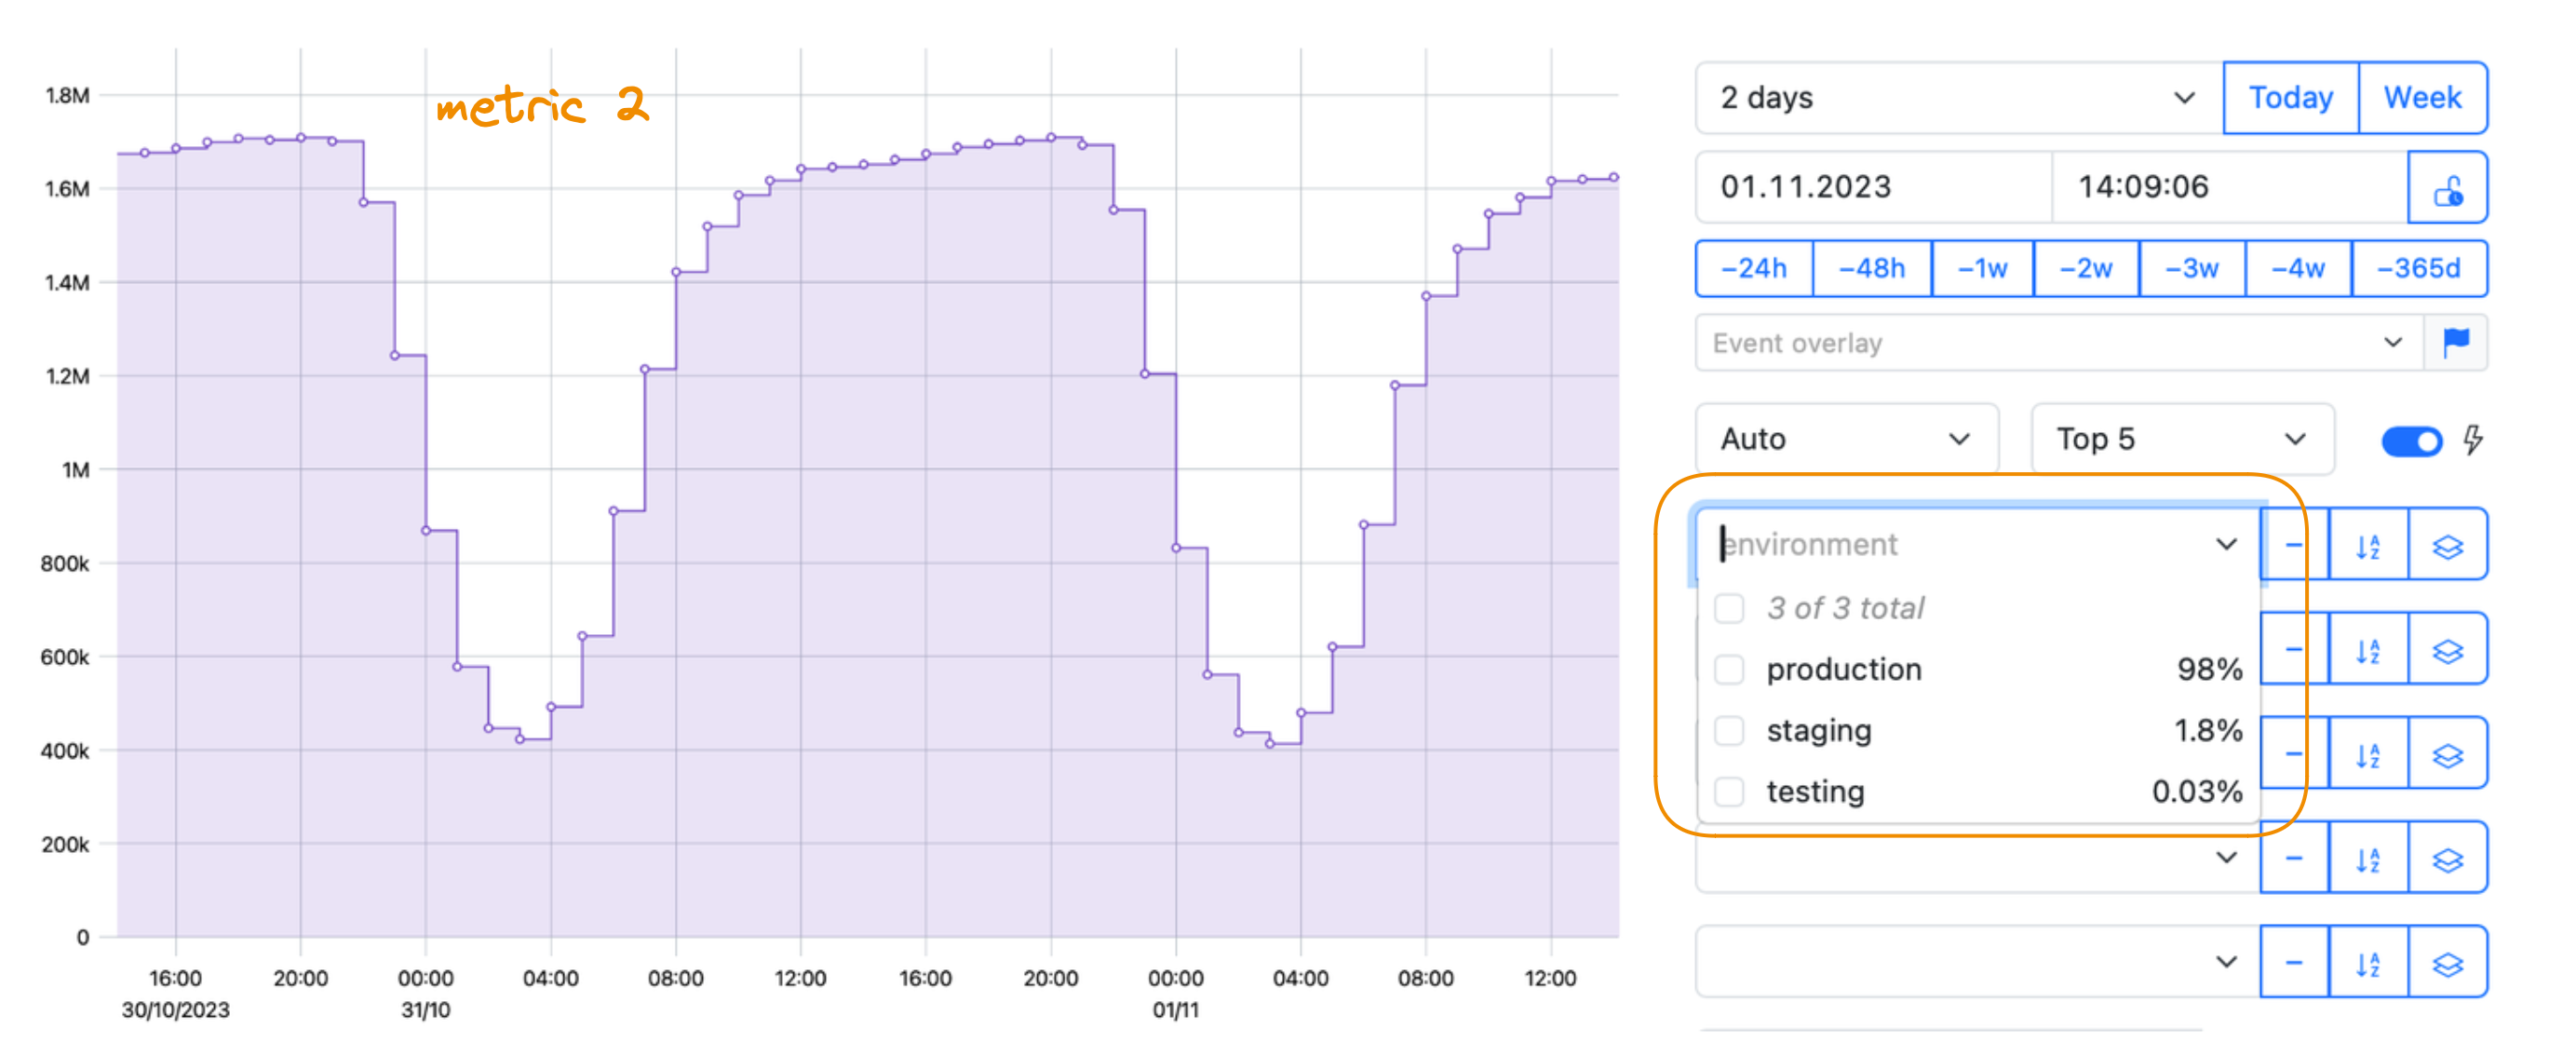
The second metric's environment tag has three values (production, staging, testing):
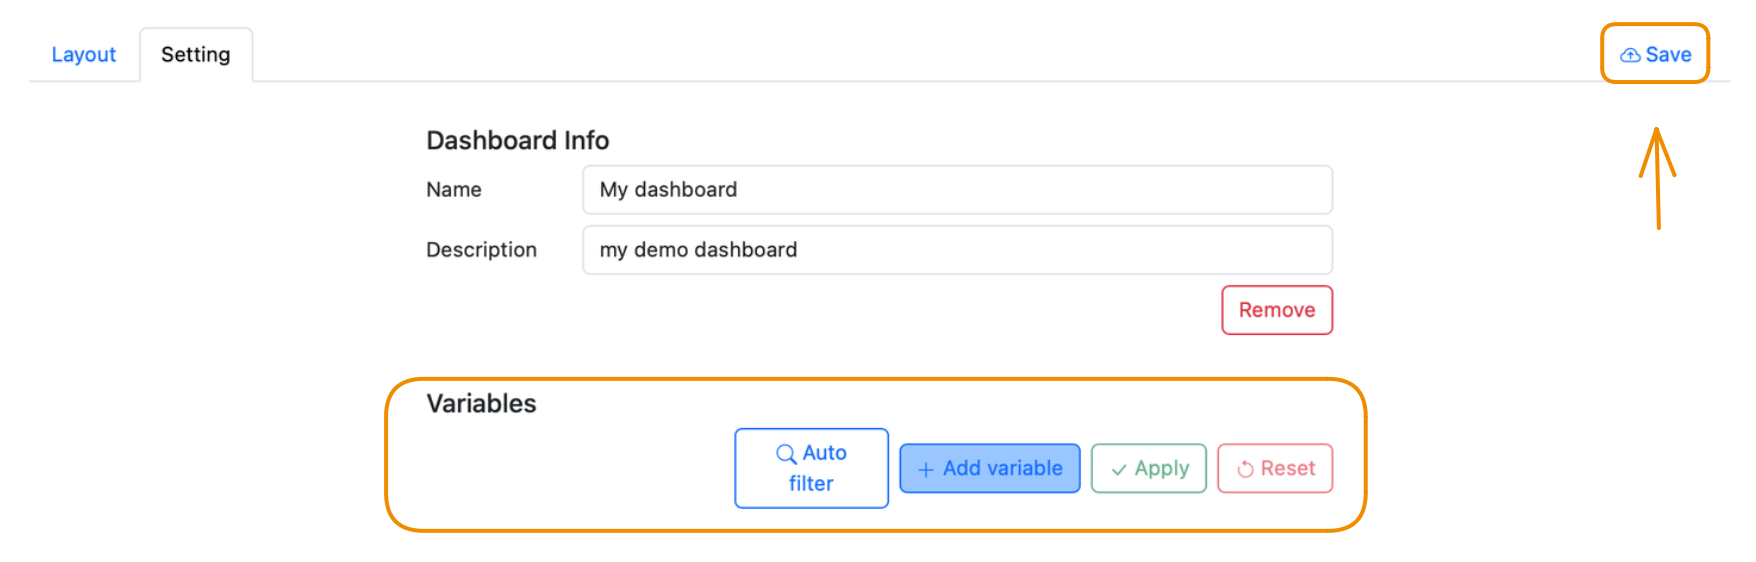
In the Setting section, Add variable manually (remember to Save changes):
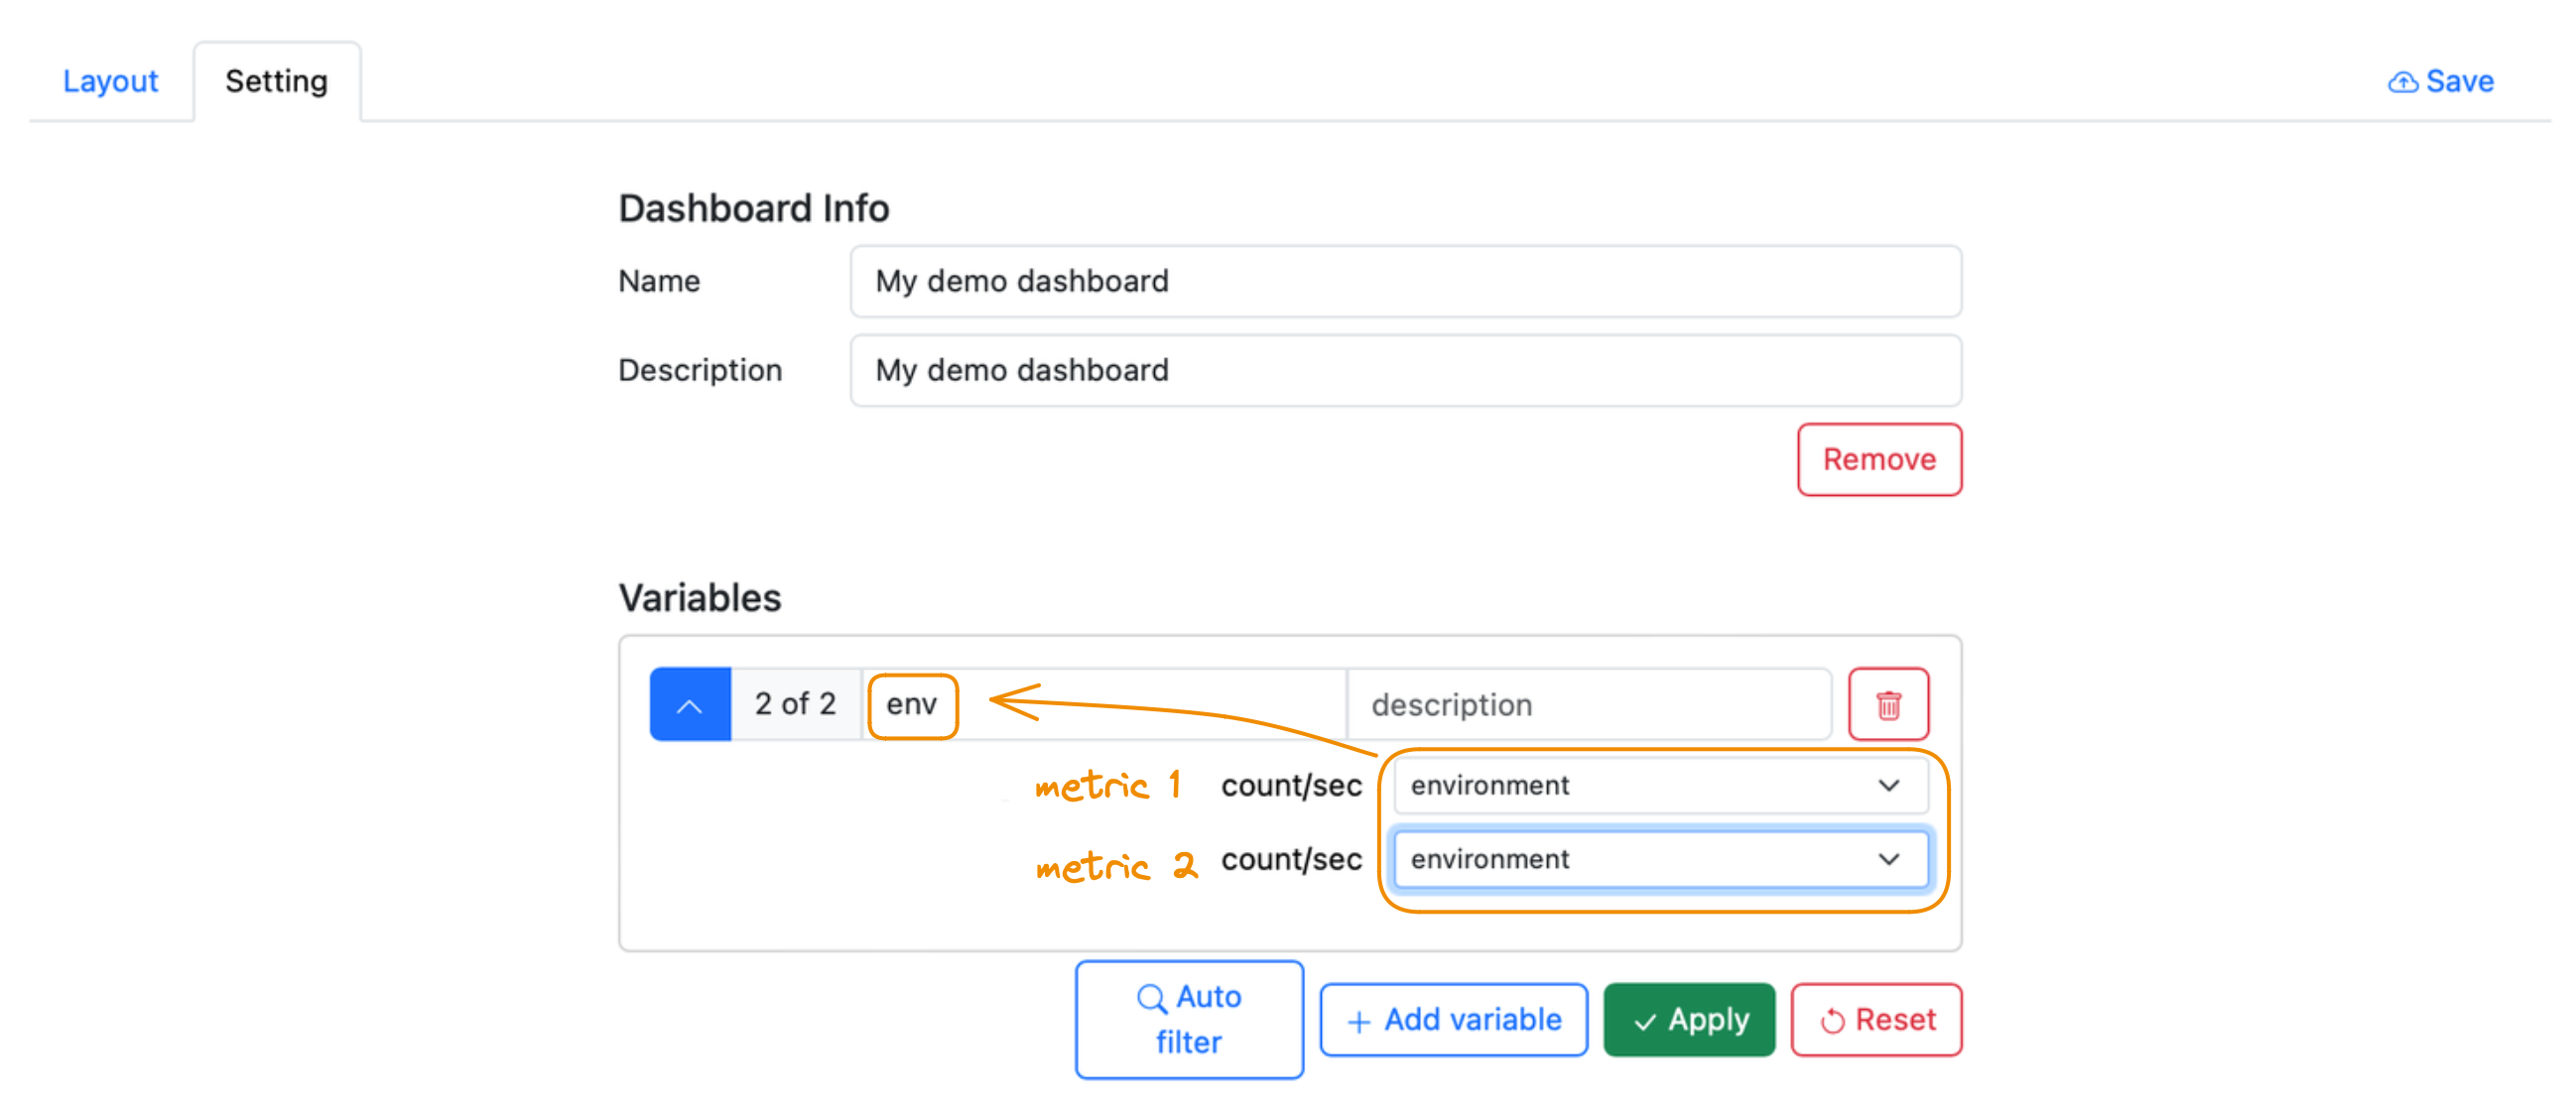
Bind the environment tags from two metrics to the env variable (remember to Apply changes):
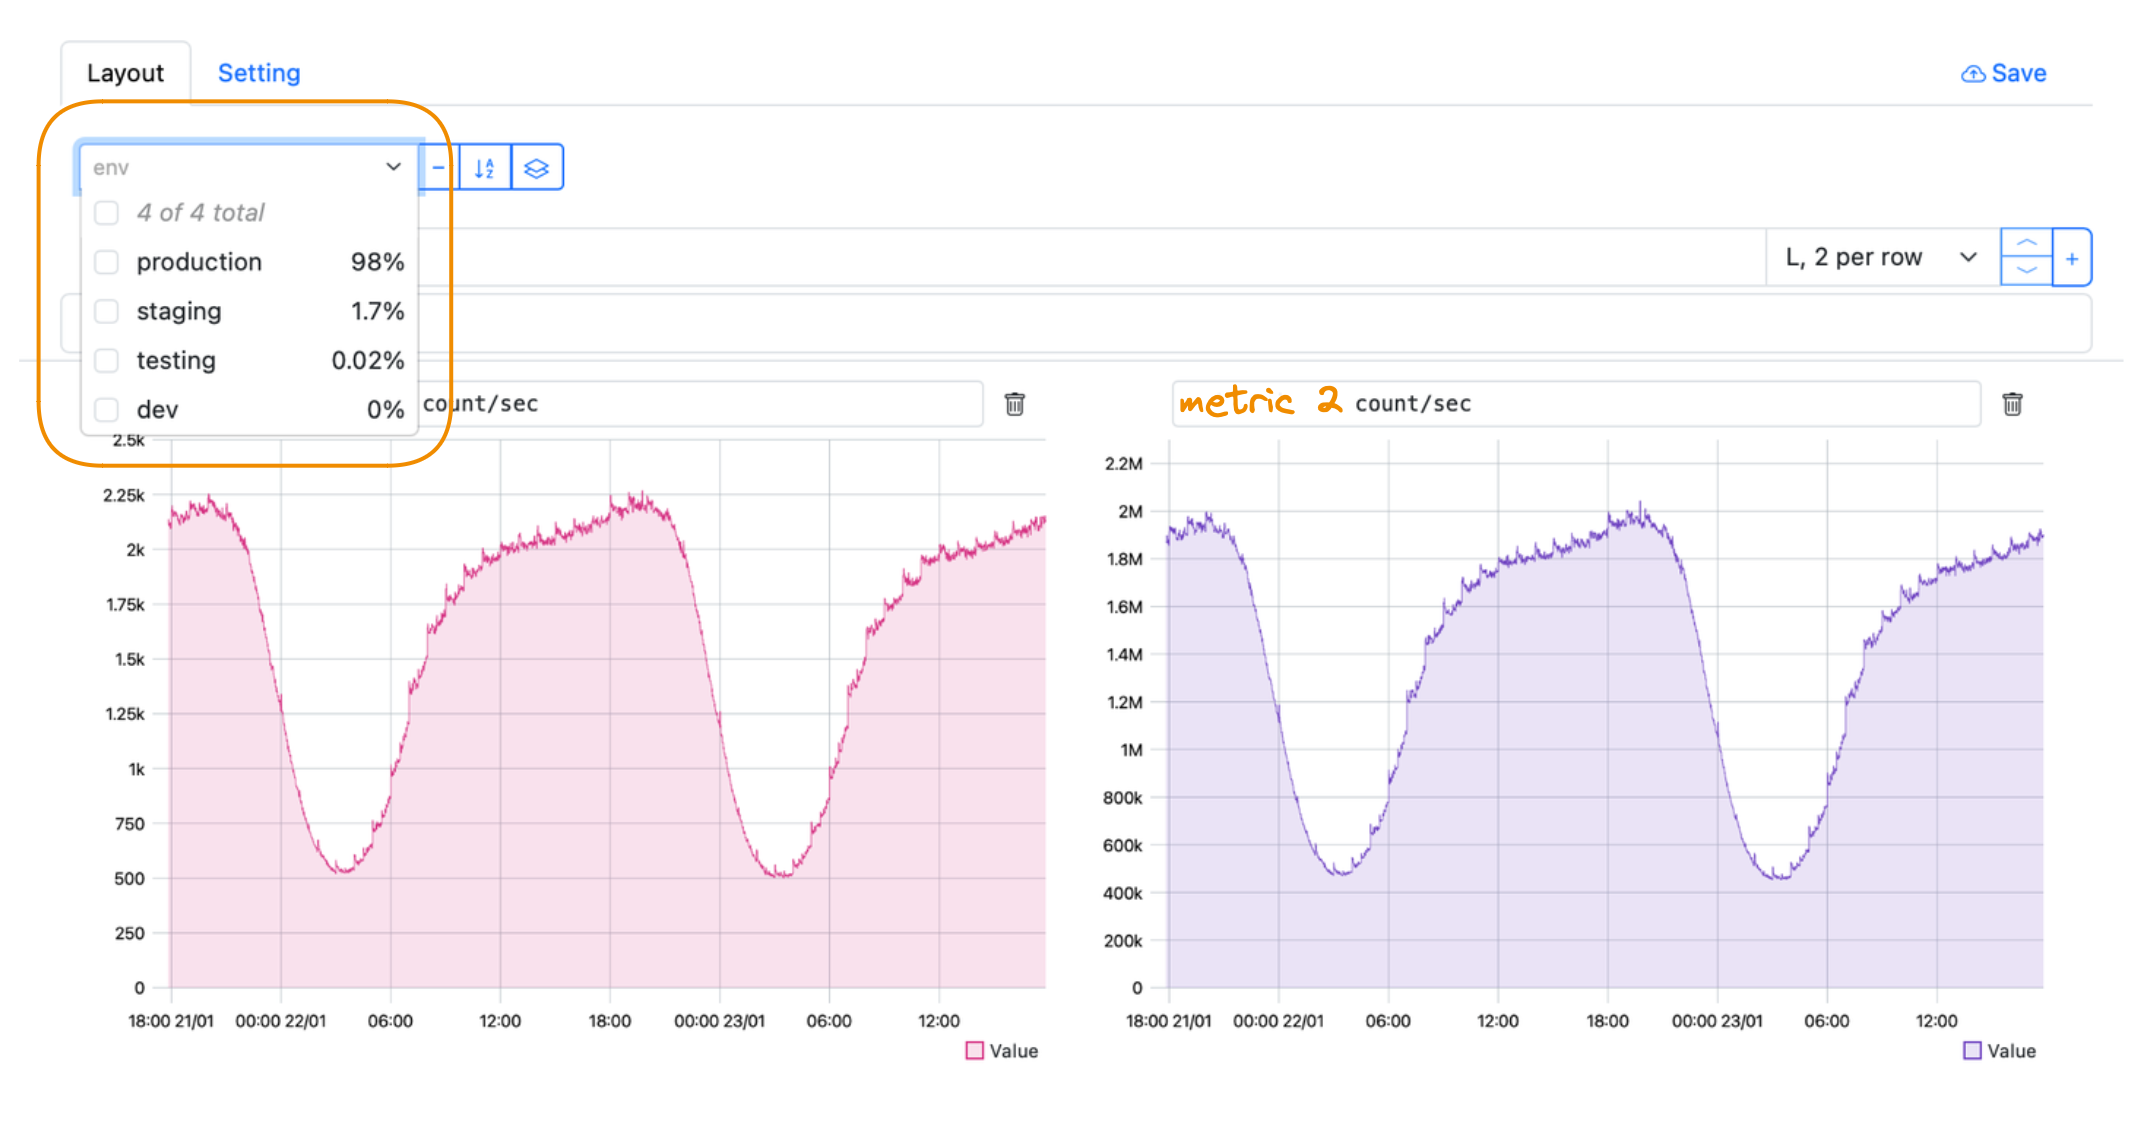
In the Layout section, see the option to filter data with the environment tag for both metrics simultaneously—with
the full list of tag values
(production, staging, testing, dev):
If two metrics have tags with the same names (such as the environment tag in our example),
use the Autofilter option to generate variables for them automatically.
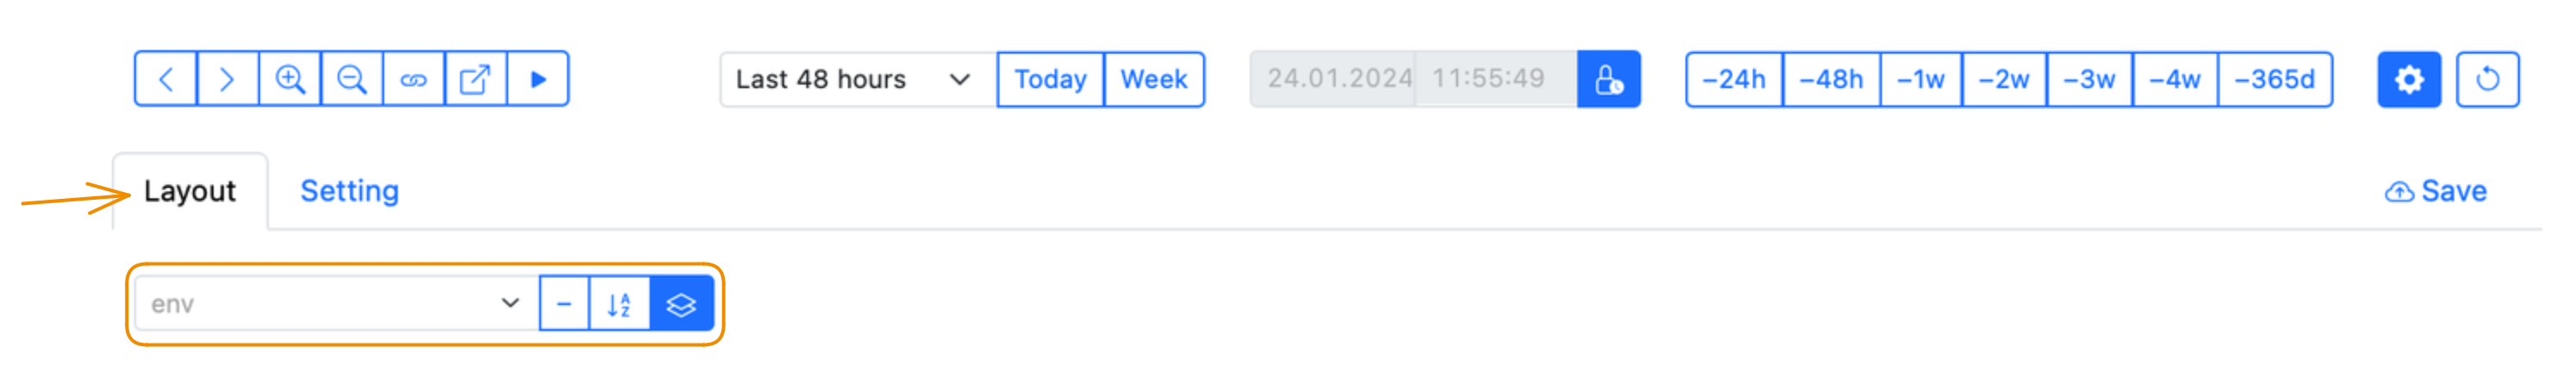
Layout
In the Layout section, set up options to filter, sort, or group data by default for all the metrics on a dashboard:
Customize the layout so that the dashboard could help you recognize the meaningful patterns in data:
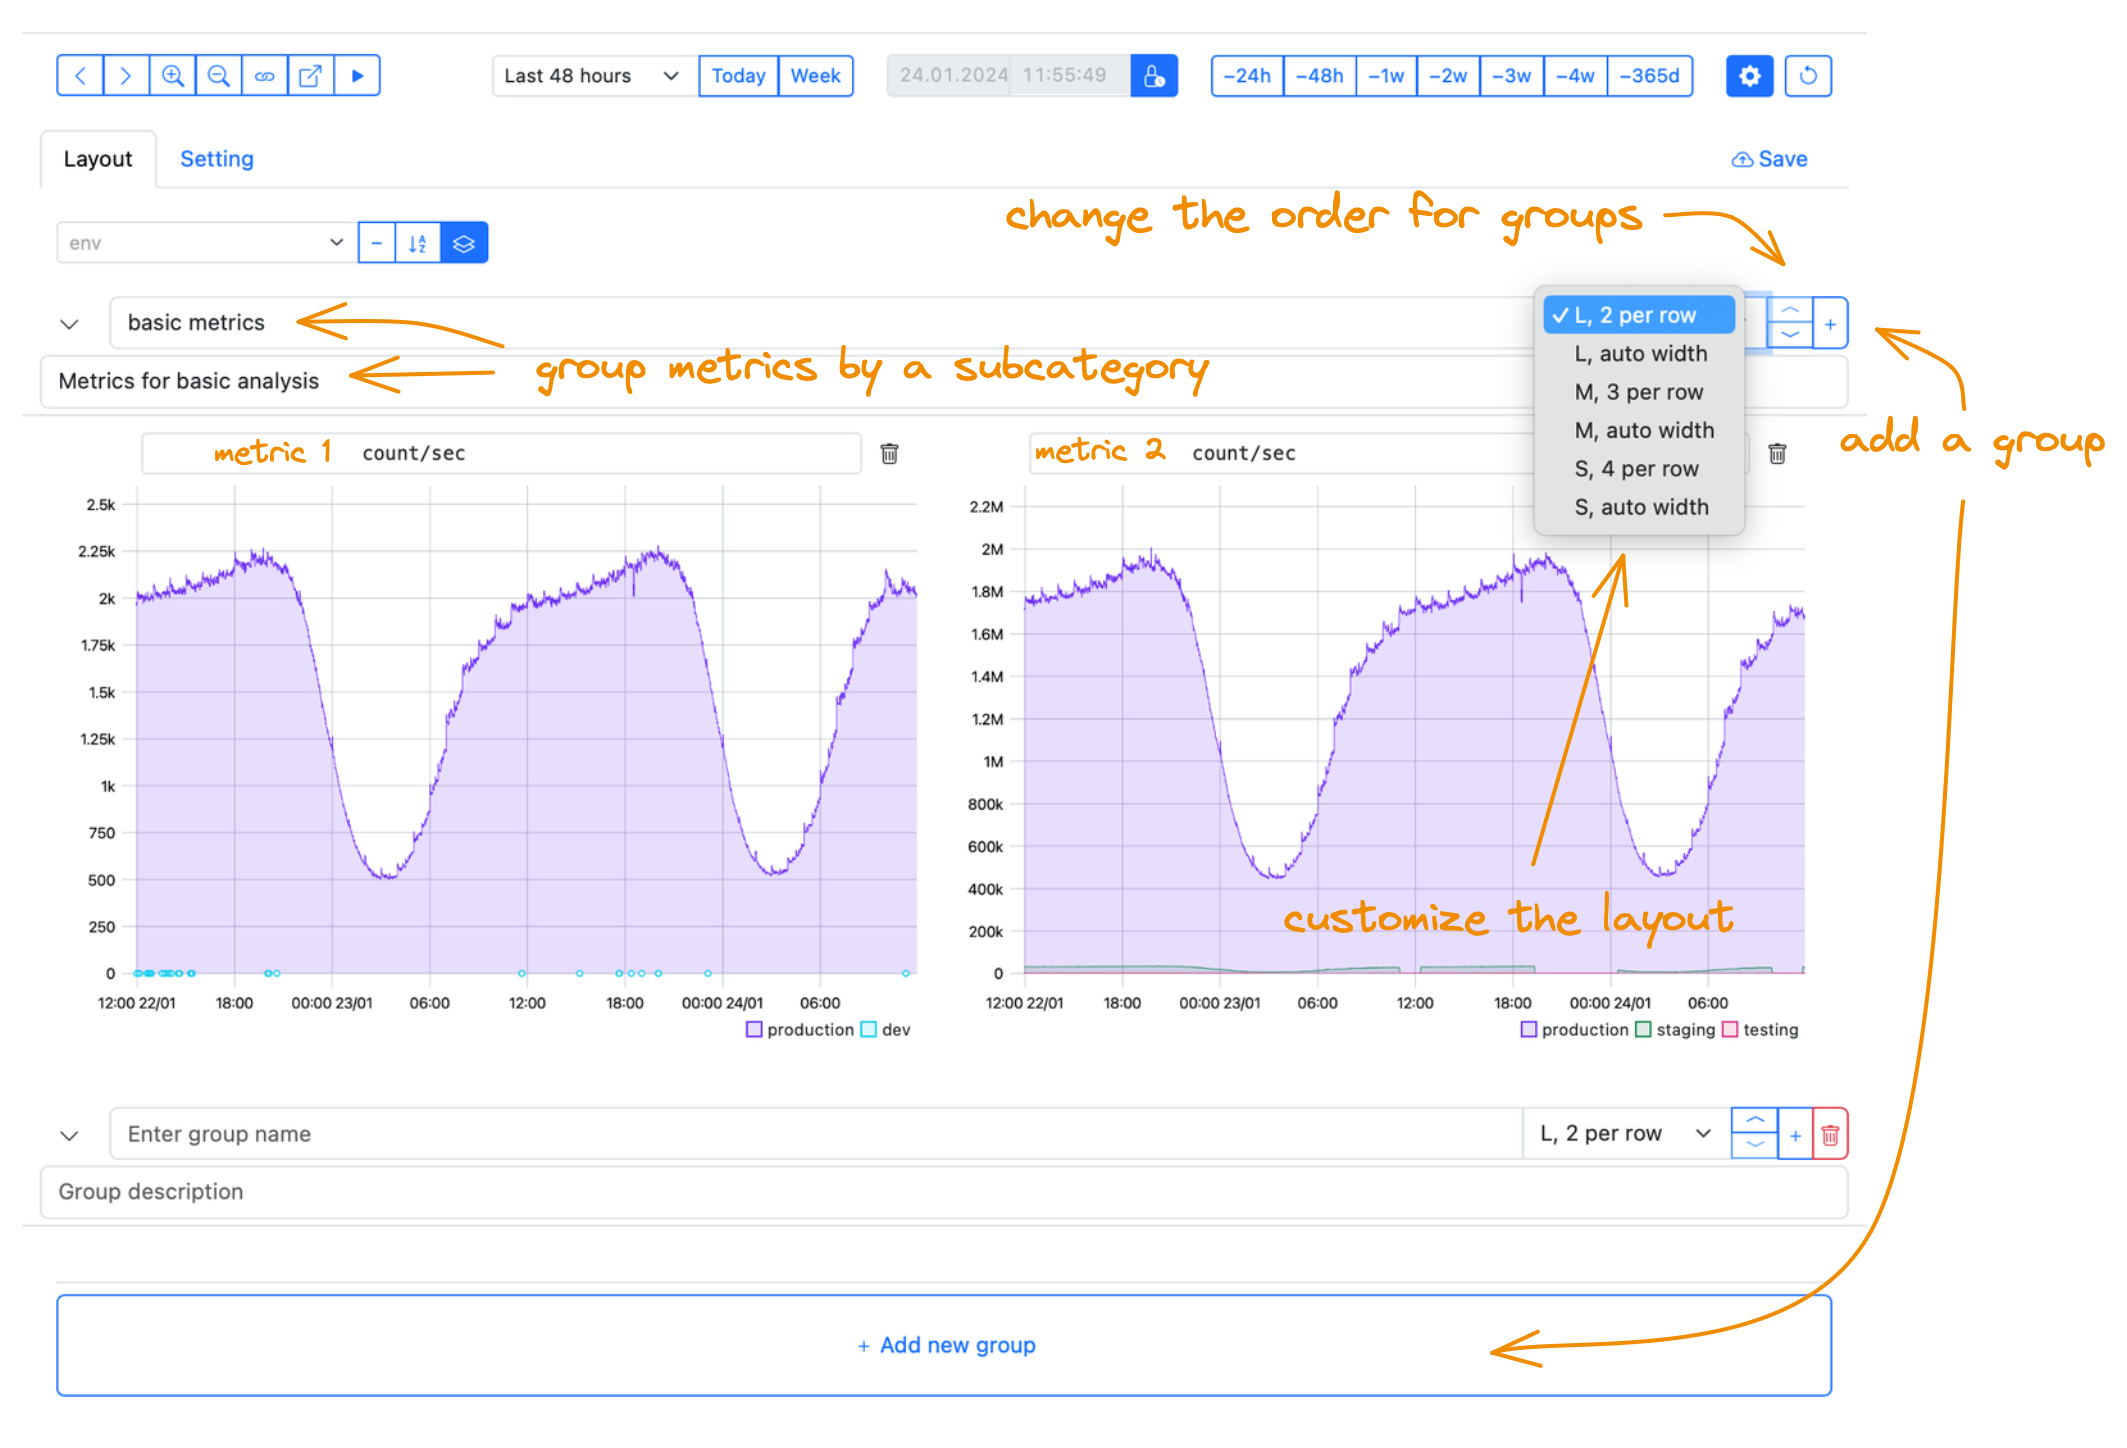
Graph width
S, M, L options are fixed graph widths, which are small, medium, and large ones. Autowidth and the number of graphs per row are the ways to arrange graphs in a group horizontally.
Play with these options to arrange the compared graphs one above or near the other.
Graph groups
Group the graphs by subcategories, describe and sort the groups for your convenience:
- In the Layout editing mode, drag and drop graphs to move them on the dashboard.
- Add a group before or after the current one.
- Collapse the infrequently used groups to save resources: the collapsed graphs are not updated upon refreshing or opening the page.
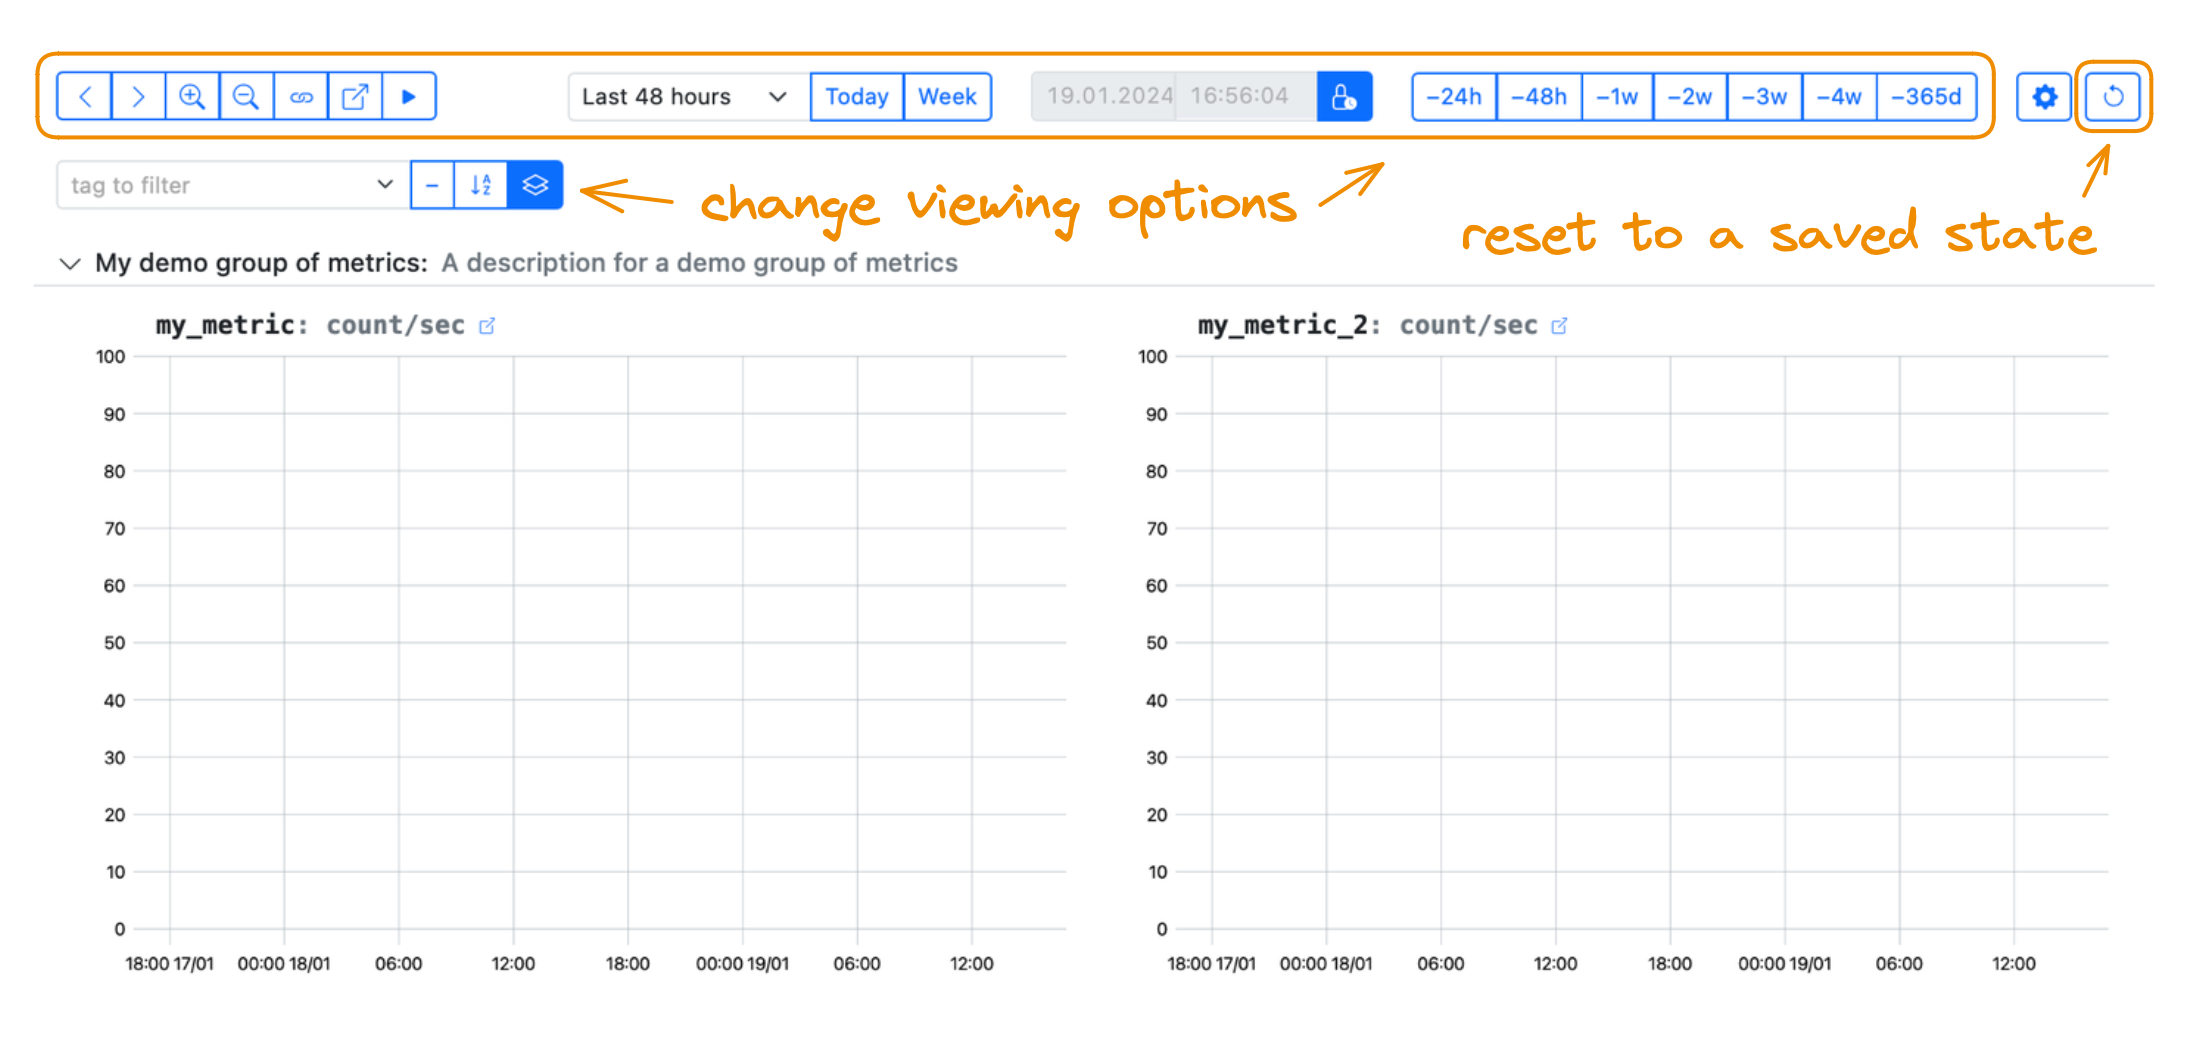
View a dashboard
Use the same viewing options as for the graphs. Reset to a saved state, if necessary:
Remove a dashboard
To get rid of an unused dashboard, proceed to editing the dashboard. In the Setting section, press the Remove button:
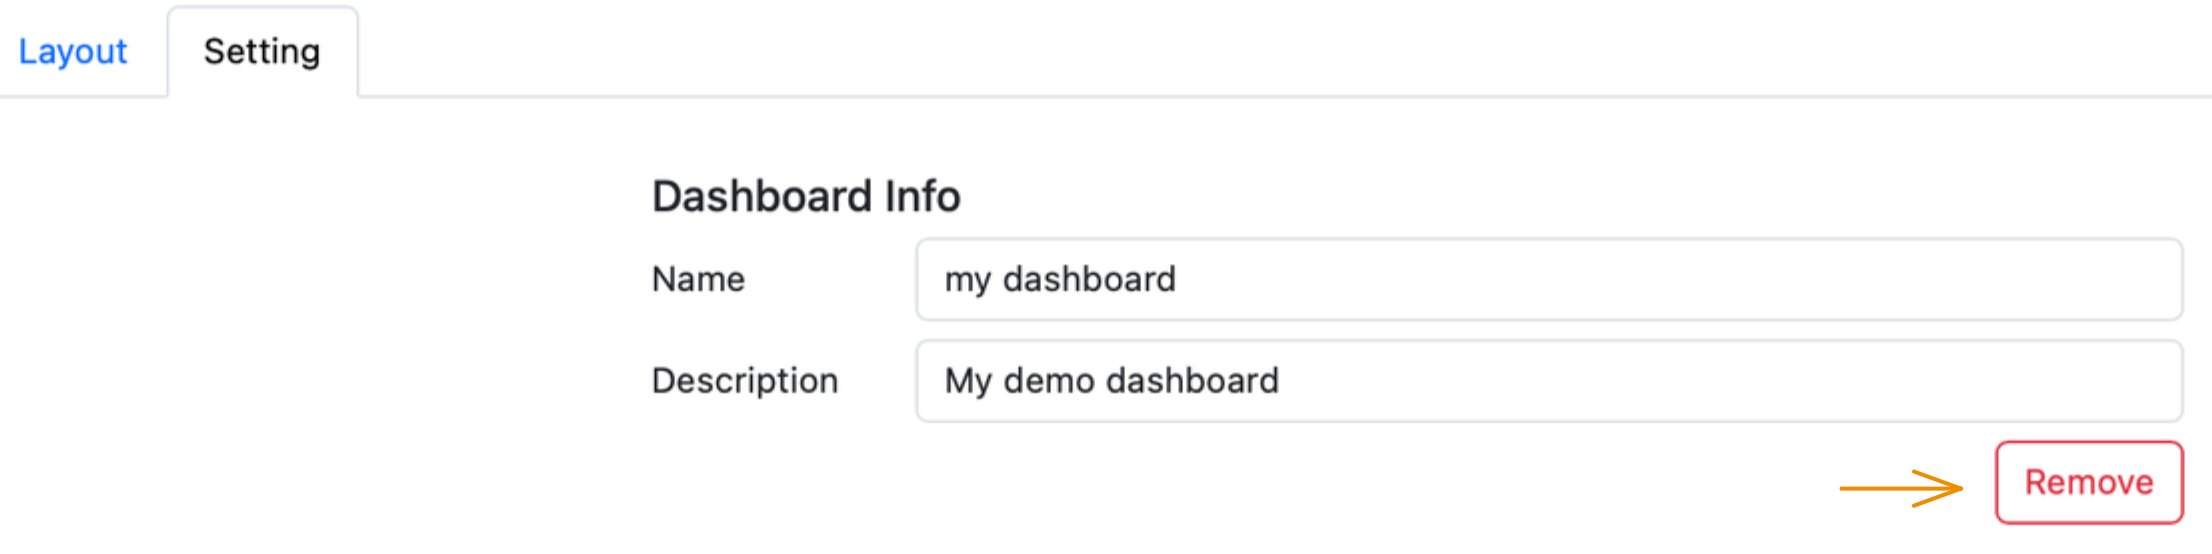
The removed dashboard disappears from the dashboard list but still exists, so you cannot use the same dashboard name later.
Set up PromQL-based dashboards
To filter data with tags for a PromQL-based graph, create variables.
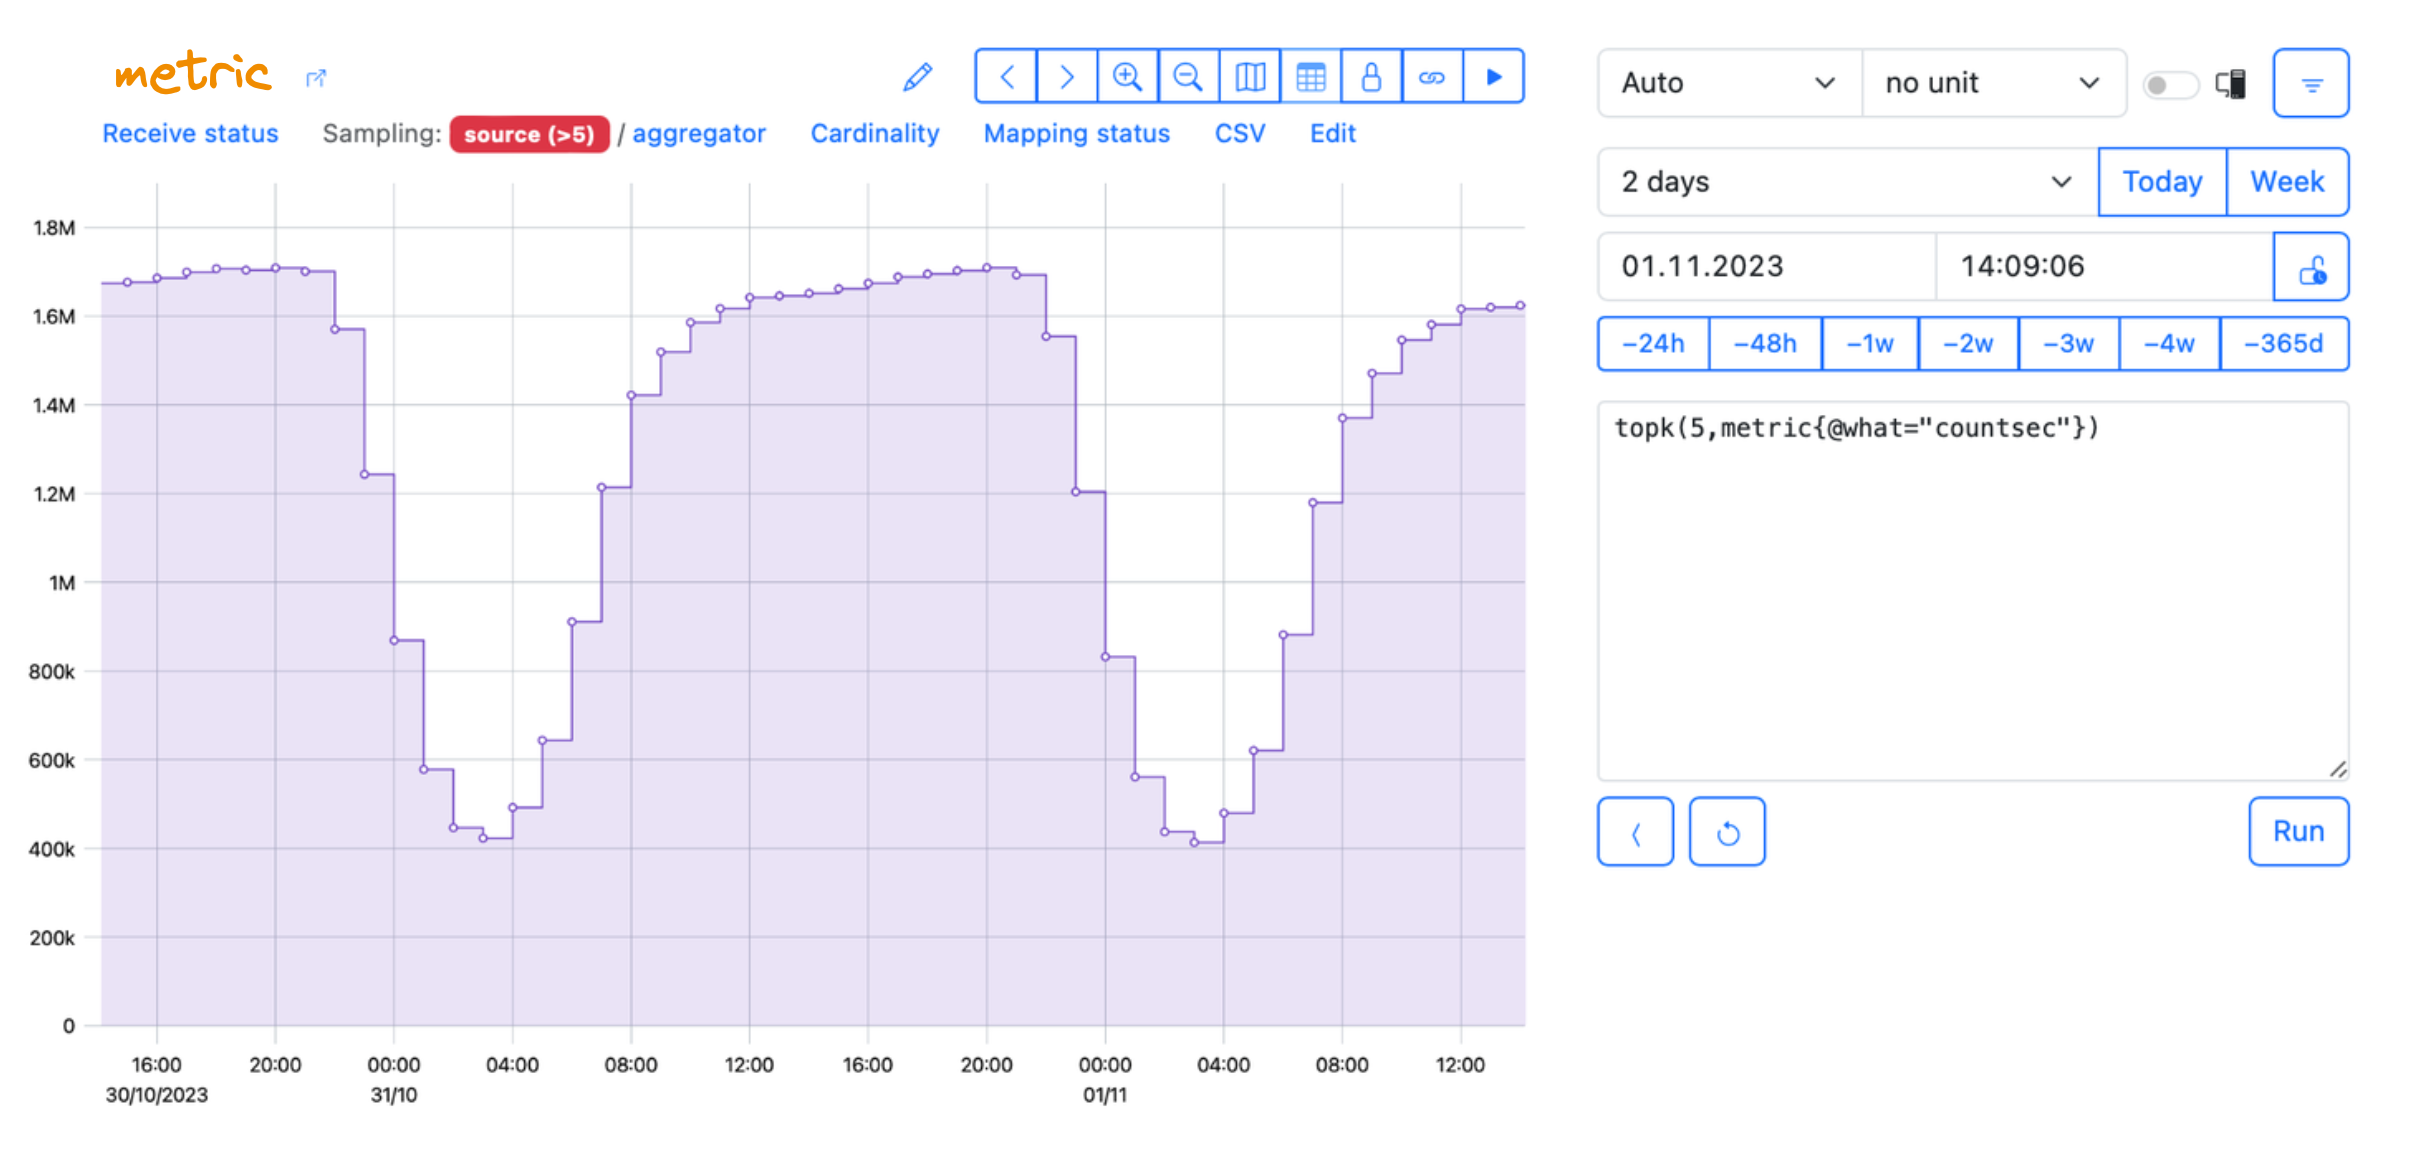
Imagine you have a PromQL-based graph with tags:
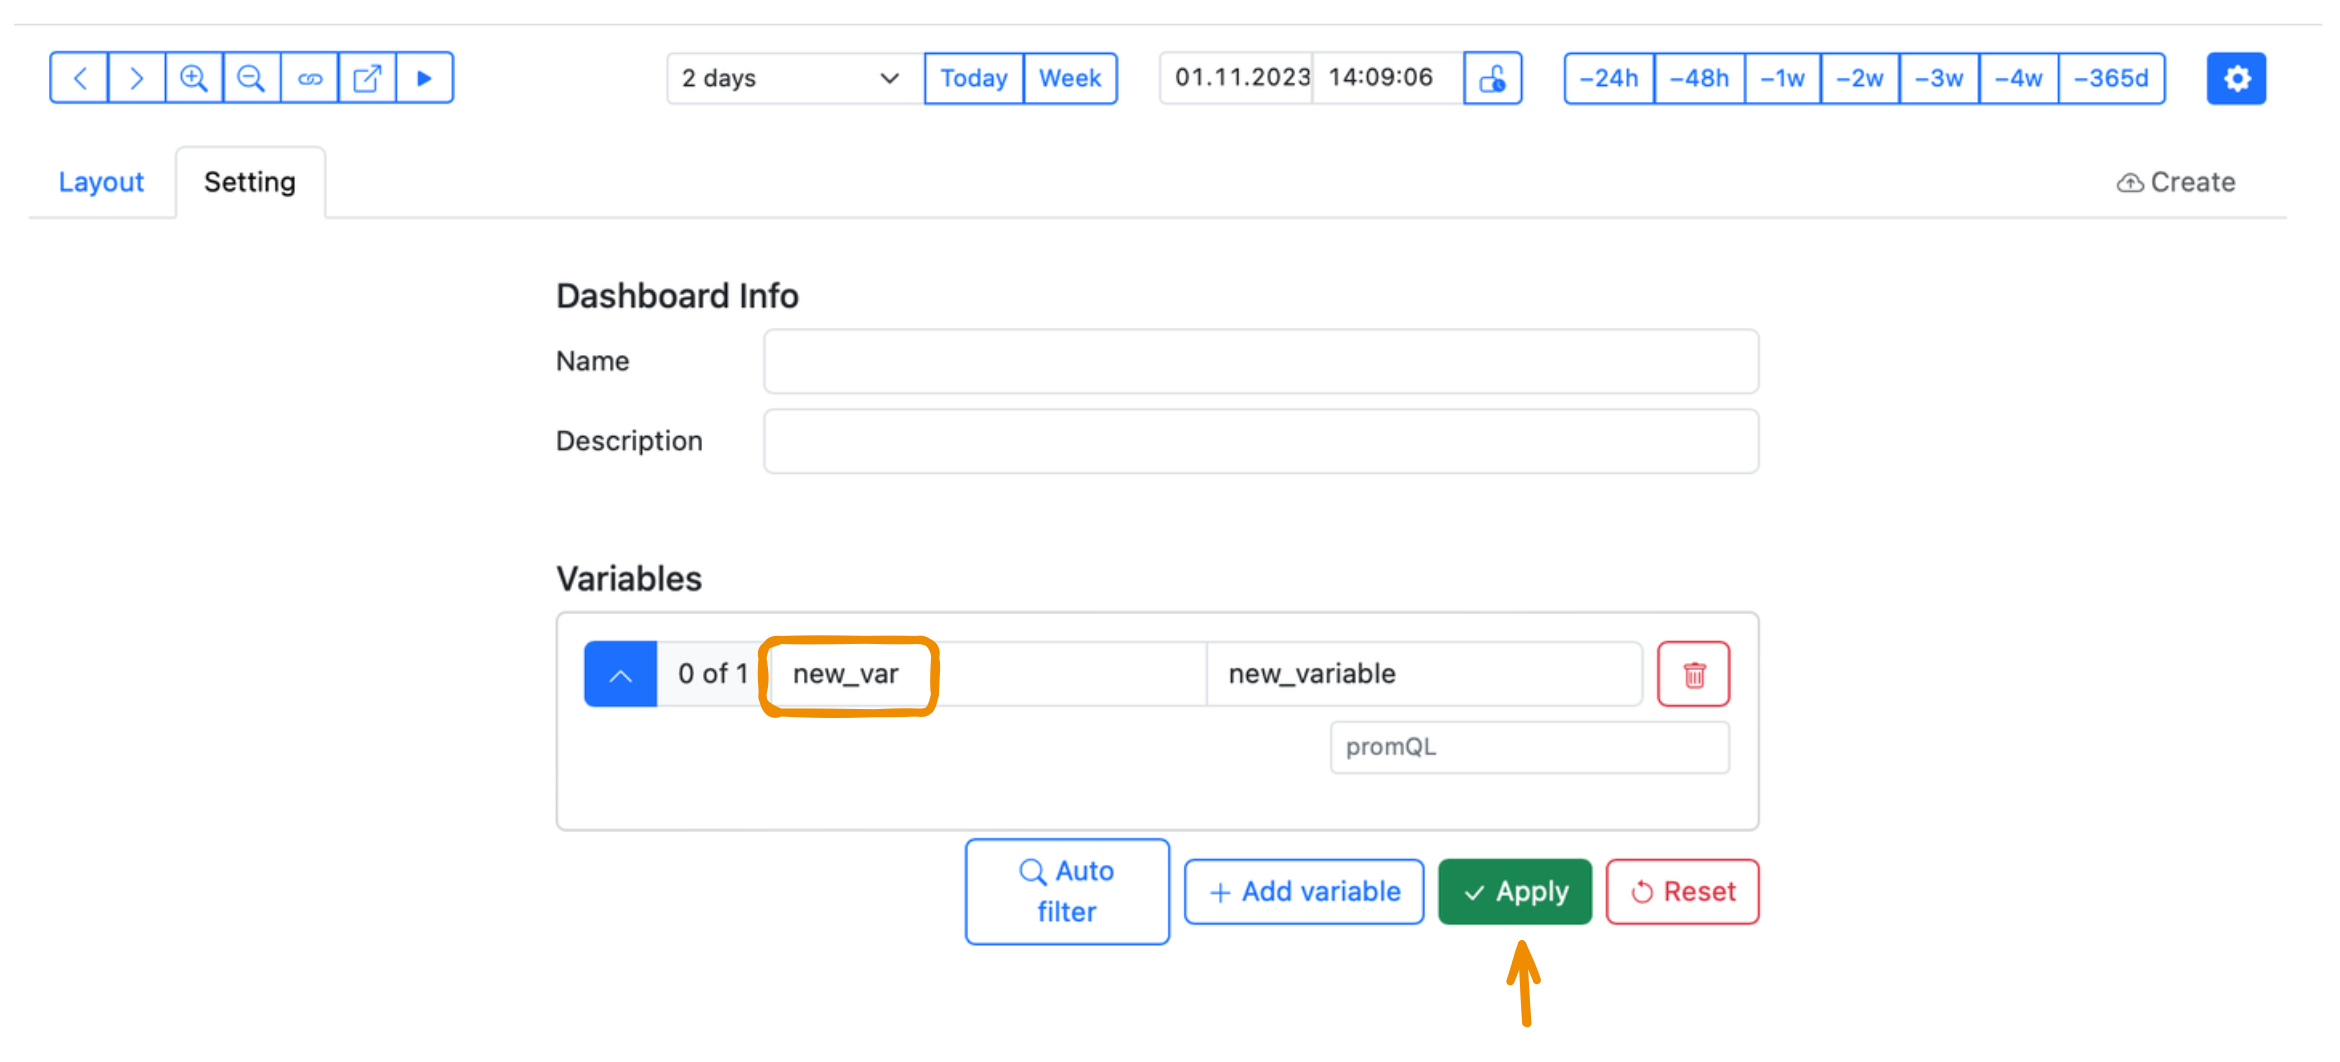
While creating the variable for the PromQL-based graph (new_var in our example), you will not see tag
names:
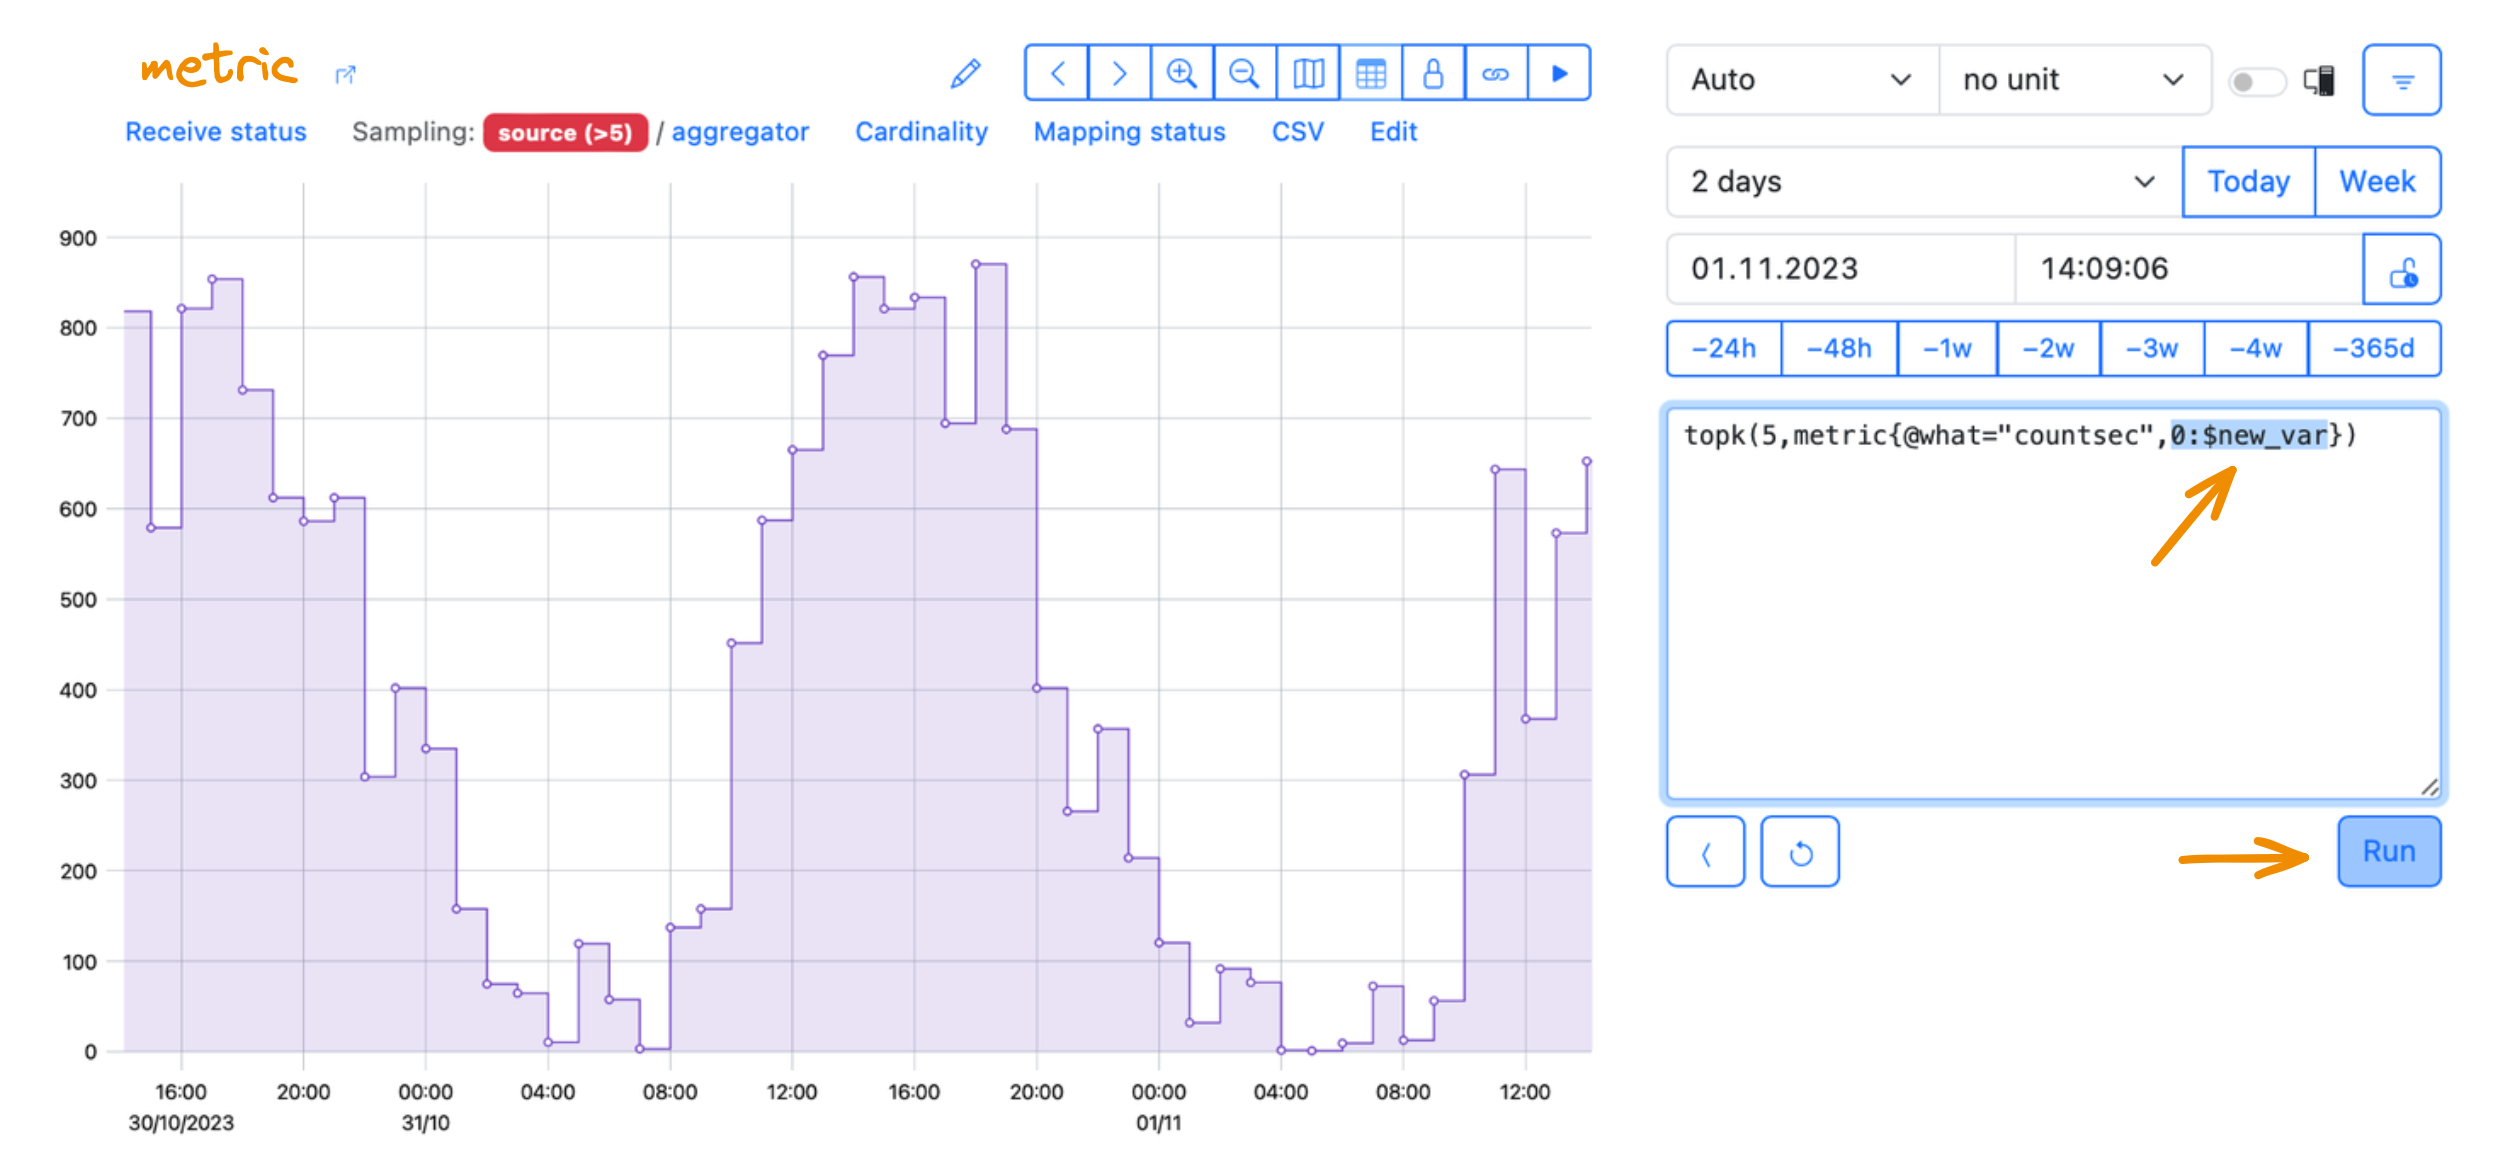
To enable filtering or grouping, get back to the graph view and use the PromQL editor. Bind the tag to the previously created variable in your PromQL query and press Run:
In this example, the initial query was:
topk(5,metric{@what="countsec"}),
and we bound the 0 tag (that means environment) with the new_var variable:
topk(5,metric{@what="countsec",0:$new_var}).
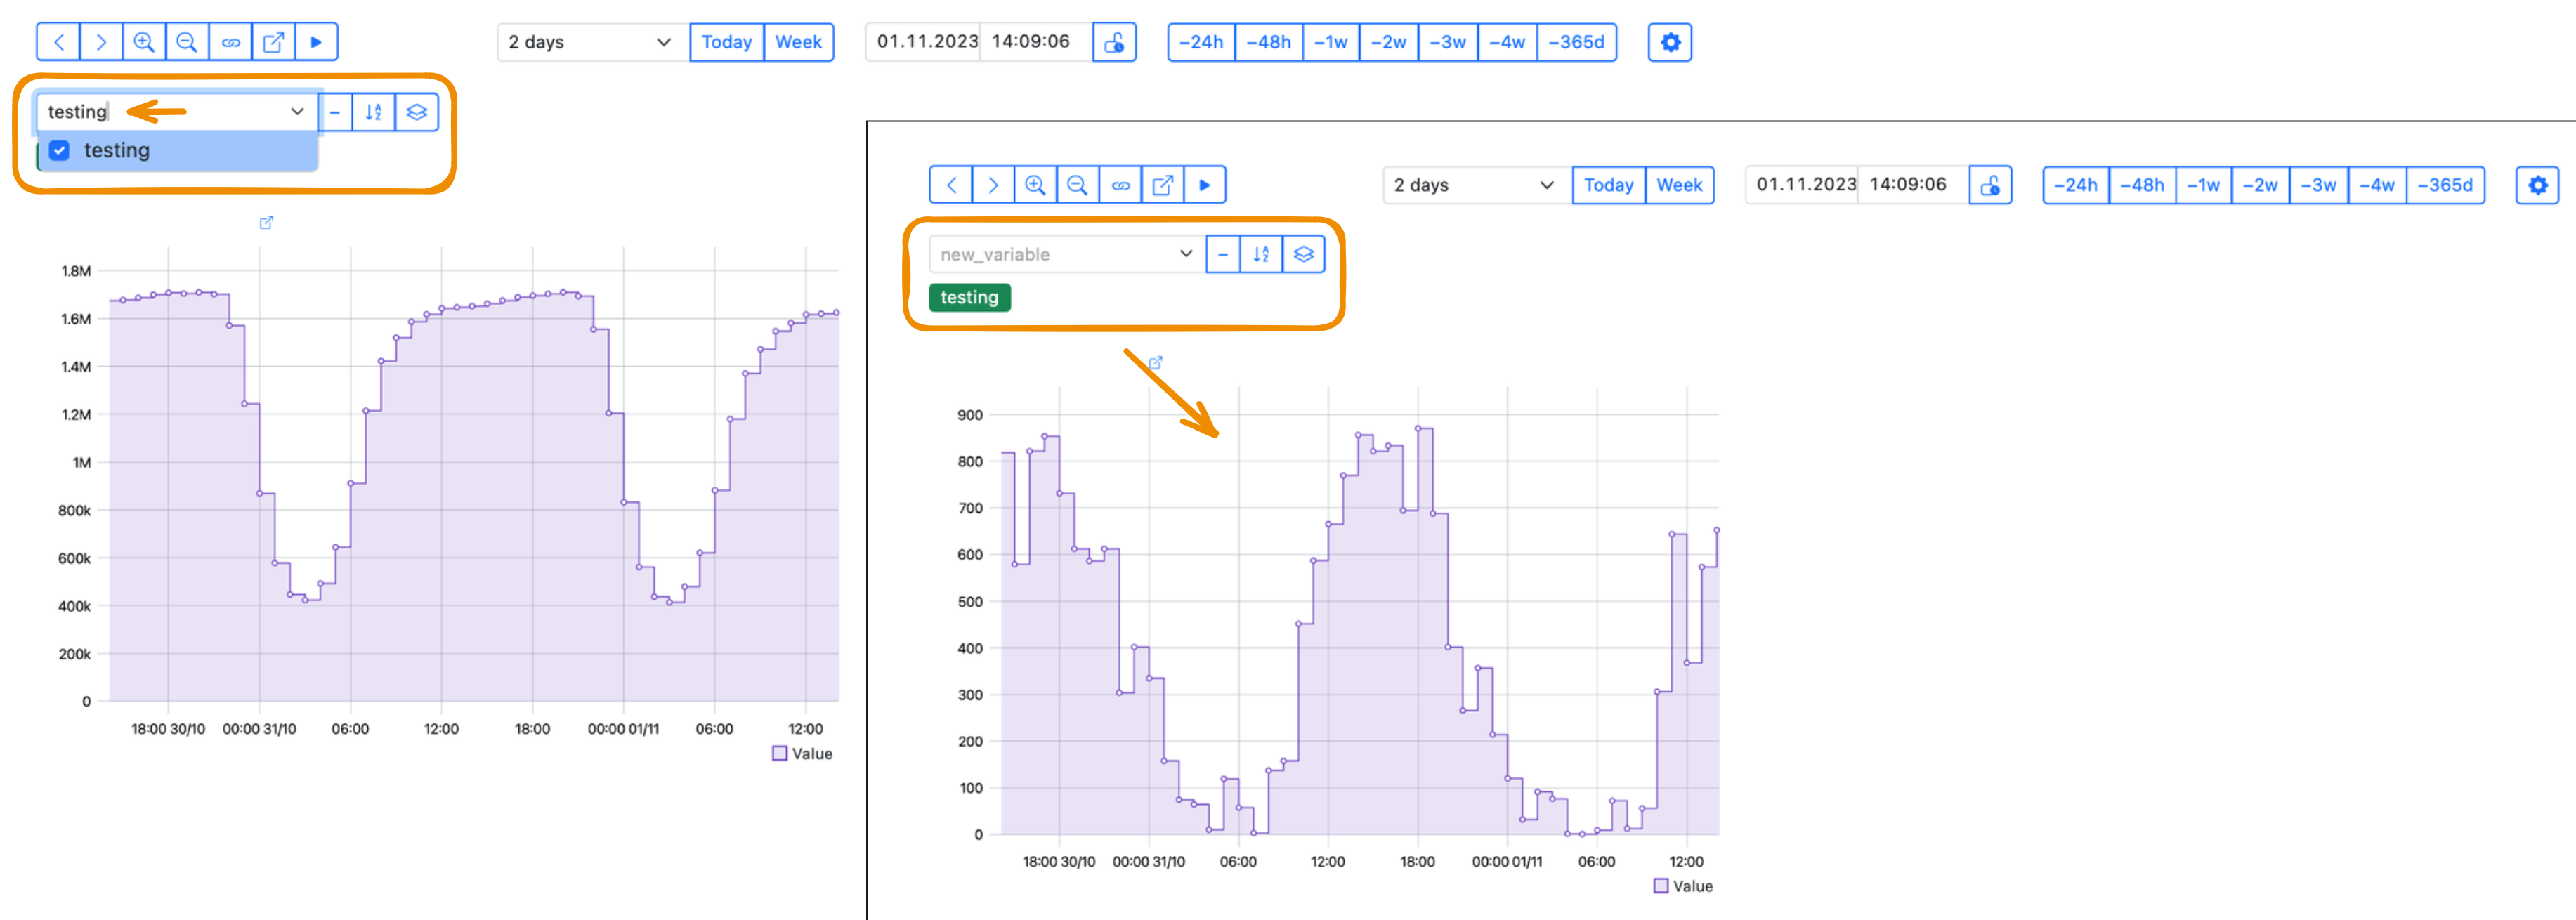
Then the filtering controls appear in the Layout section and in the Dashboard view. To filter data with the particular tag value, enter the value name manually:
When adding more PromQL-based graphs to a dashboard, make sure you bind the necessary tags to the corresponding variables for each graph.