Install components
Here is the flow to install StatsHouse components (1 → 5):
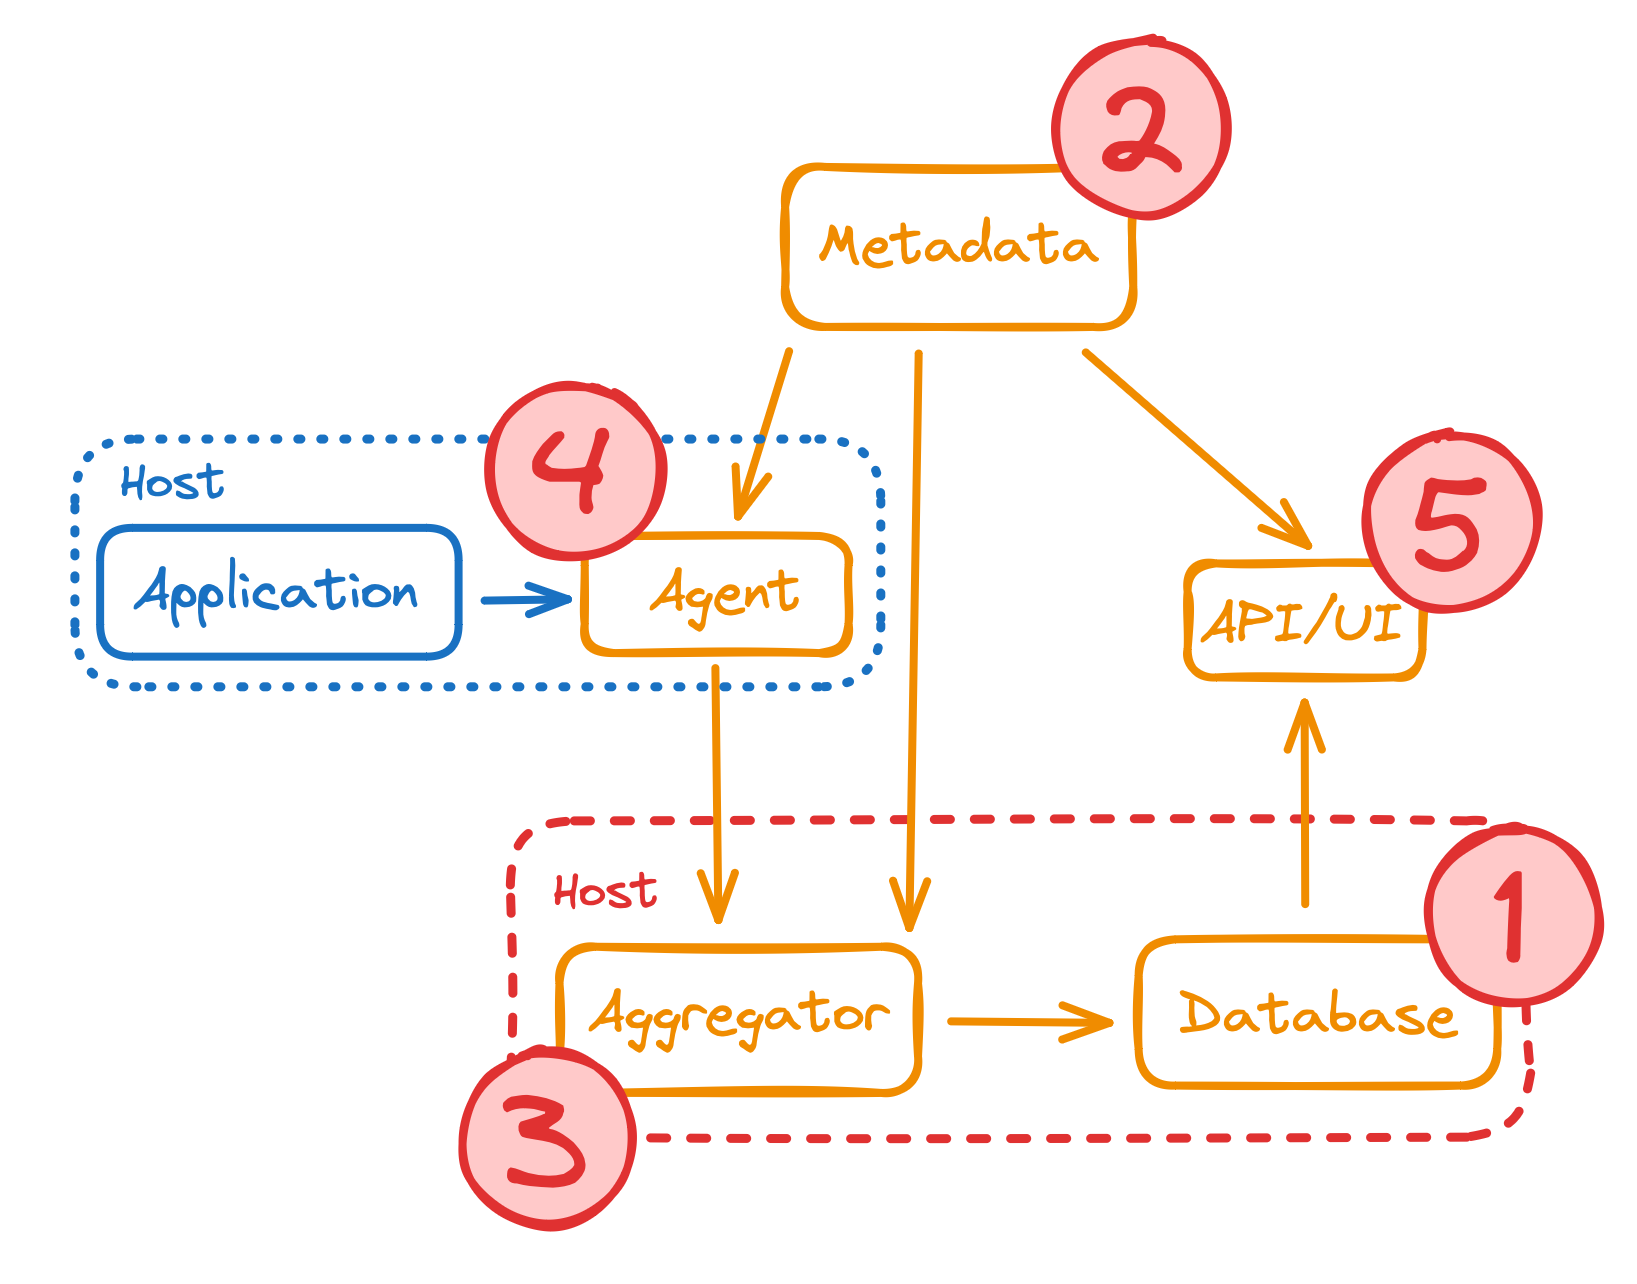
The local StatsHouse installation is almost the same. The only difference is that the local installation script puts the ClickHouse database and aggregator on different virtual machines. To install StatsHouse on the real servers, use the same machine for the ClickHouse database and the aggregator.
Read more about the StatsHouse components.
ClickHouse database
Read more about the StatsHouse database component in the conceptual overview.
Check the system requirements for the ClickHouse machines. We recommend using fast SSDs for storing per-second data, so that StatsHouse is able to provide you with the live mode. See more about the ClickHouse configuration (storage policies).
Cluster scheme
The ClickHouse cluster must have three replicas per shard. You can have any number of shards (one or more).
Find the scheme to create the necessary ClickHouse tables.
Cluster configuration (storage policies)
Find the example of the ClickHouse cluster configuration:
<storage_configuration>
<disks>
  <clickhouse_fast>
    <path>/var/lib/clickhouse-fast/</path>
  </clickhouse_fast>
</disks>
<policies>
  <ssd_then_hdd>
    <volumes>
      <ssd>
        <disk>clickhouse_fast</disk>
      </ssd>
      <hdd>
        <disk>default</disk>
      </hdd>
    </volumes>
  </ssd_then_hdd>
</policies>
</storage_configuration>
This policy means that ClickHouse should initially insert data into the fast SSDs, and then move it to the slower HDDs.
This configuration is applied to a created table: see the above-mentioned scheme.
Metadata service
As soon as you have created the ClickHouse tables, proceed to metadata service installation.
Read more about the StatsHouse metadata component in the conceptual overview.
You may install the metadata service on any machine. You have one metadata service instance.
To handle the possible failure of the metadata service, back up it manually. Now, one can copy the
database binlog once a day using the cron job to restart the service if necessary.
We are now developing our own consensus mechanism to make the metadata service distributed.
The metadata service needs the following parameters:
--db-paththat is the place to store data;--binlog-prefixthat is the place to store the binlog.
Find the example of the metadata service installation script:
statshouse-metadata --db-path=/var/lib/statshouse/metadata/db --binlog-prefix=/var/lib/statshouse/metadata/binlog/bl
The aggregator, the API/UI component, and the agents need to know the metadata address. The agents get this information from the aggregators.
The metadata service has its agent too.
In case of metadata service failure
If the metadata service is unreachable, StatsHouse cannot create new metrics and tags, and use tag information (see more about the mapping mechanism).
Each StatsHouse component has its metadata copy and continues working even in case of metadata failure. But if the component fails too, it will not be able to restore.
In case of aggregator failure, restore the metadata service with the same IP address as soon as possible.
Aggregators
Read more about the StatsHouse aggregator component in the conceptual overview.
The aggregator needs to know where to find the cluster, so please specify the following parameters:
--clusterthat is the cluster name,--khthat is the database address (the database may contain many clusters),--agg-addrthat is the port to listen to,--aes-pwd-filethat is the directory with the encryption key (the obligatory start parameter:/etc/engine/passby default),--cache-dirthat is the directory to store data in case the database does not insert data,-u,-gthat are the group and the user (the obligatory start parameters).
On each ClickHouse replica, install the StatsHouse aggregator. Find the example of the aggregator installation script:
statshouse aggregator --cluster=test_shard_localhost --agg-addr=':13336' --aes-pwd-file=/etc/engine/pass \
--kh=XXX.X.X.X:XXXX --cache-dir=/var/lib/statshouse/cache/aggregator -u=root -g=root
As the aggregators get the ClickHouse cluster address, they get info about the shard and the replica they are installed on.
The agents need all the aggregators' addresses. Each agent scans these addresses successively and tries to get the necessary configuration from the first available one. The agent sends the data to the aggregators in a pseudorandom order.
The aggregator starts with the --aes-pwd-file parameter that is the directory containing a key to decrypt the
incoming traffic. Read more about the --aes-pwd-file parameter and the encryption keys in the
security section.
The size of the --cache-dir directory should be enough to store data resulting from six hours of the aggregator
working.
Agents
Make sure an agent is installed on each machine that sends metrics to StatsHouse:
- the ClickHouse/aggregators' machines,
- the metadata service machine,
- the API/UI ocmponent machine.
The agent opens the local port (13337, by default) and gets data from the application. Then it sends the data to the aggregators.
Read more about the StatsHouse agent component in the conceptual overview.
The agents are available as the RPM or DEB packages, for example:
statshouse-2024.05.1-1.almalinux9.x86_64.rpm or statshouse_2024.05.1-focal_amd64.deb.
The agent needs the following parameters:
--agg-addrthat is the aggregators' (or the proxies') addresses,--aes-pwd-filethat is the directory with the encryption key (encrypting the data the agent sends to the aggregator or the ingress proxy),--cache-dirthat is the directory to store data in case the aggregator is unavailable,--env-file-path(optional) that is the file to configure tags for the host (hardware) metrics.
Find the example of the agent installation script:
statshouse agent --agg-addr=XX.XXX.XXX.XXX:XXXX,YY.YYY.YYY.YYY:YYYY,ZZ.ZZZ.ZZZ.ZZZ:ZZZZ \
--aes-pwd-file=/etc/engine/pass --cache-dir=/var/lib/statshouse/
The size of the --cache-dir directory should be enough to store data resulting from six hours of the agent working.
If the aggregators are unavailable for more than six hours, the older data is deleted from the disk.
Read more about the --aes-pwd-file parameter and the encryption keys in the security section.
Read more about using tags for the host (hardware) metrics
and the --env-file-path parameter.
How to monitor the agent's health
- Open the
__heartbeat_versionservice metric that shows the number of running components. - For the
componenttag, select theagenttag value. - For the
hosttag, select the required hostname. - Check if you see the heartbeat from the host.
Additionally, check if the agent is able to send real metric data: send a testing piece of data from the host.
API/UI
The API component has the StatsHouse user interface as its part. As soon as you start the API/UI component, you can view the service metrics that help to monitor StatsHouse.
You can install the API component on any machine.
The API component needs the following parameters:
--clickhouse-v2-addrsthat is the ClickHouse cluster address,--listen-addrthat is the port to listen to,--disk-cachethat is the place to store the cached globalstring↔int32map,--static-dirthat is the place where the UI static files live.
Find the example of the API/UI installation script:
statshouse-api --clickhouse-v2-addrs=XXX.X.X.X:XXXX \
--listen-addr=:YYYYY --disk-cache=/var/lib/statshouse/cache/api/mapping_cache.sqlite3 \
--static-dir=/usr/lib/statshouse-api/statshouse-ui/
Authentication
You may use an authentication mechanism you need, for example, an nginx server using JSON Web Tokens (JWT).
To use the API with no authentication, enable the --insecure-mode option.
Ingress proxy
Find information about the StatsHouse ingress proxy component in the conceptual overview. Read more about ensuring security with the ingress proxies and the cryptokeys.