What is StatsHouse?
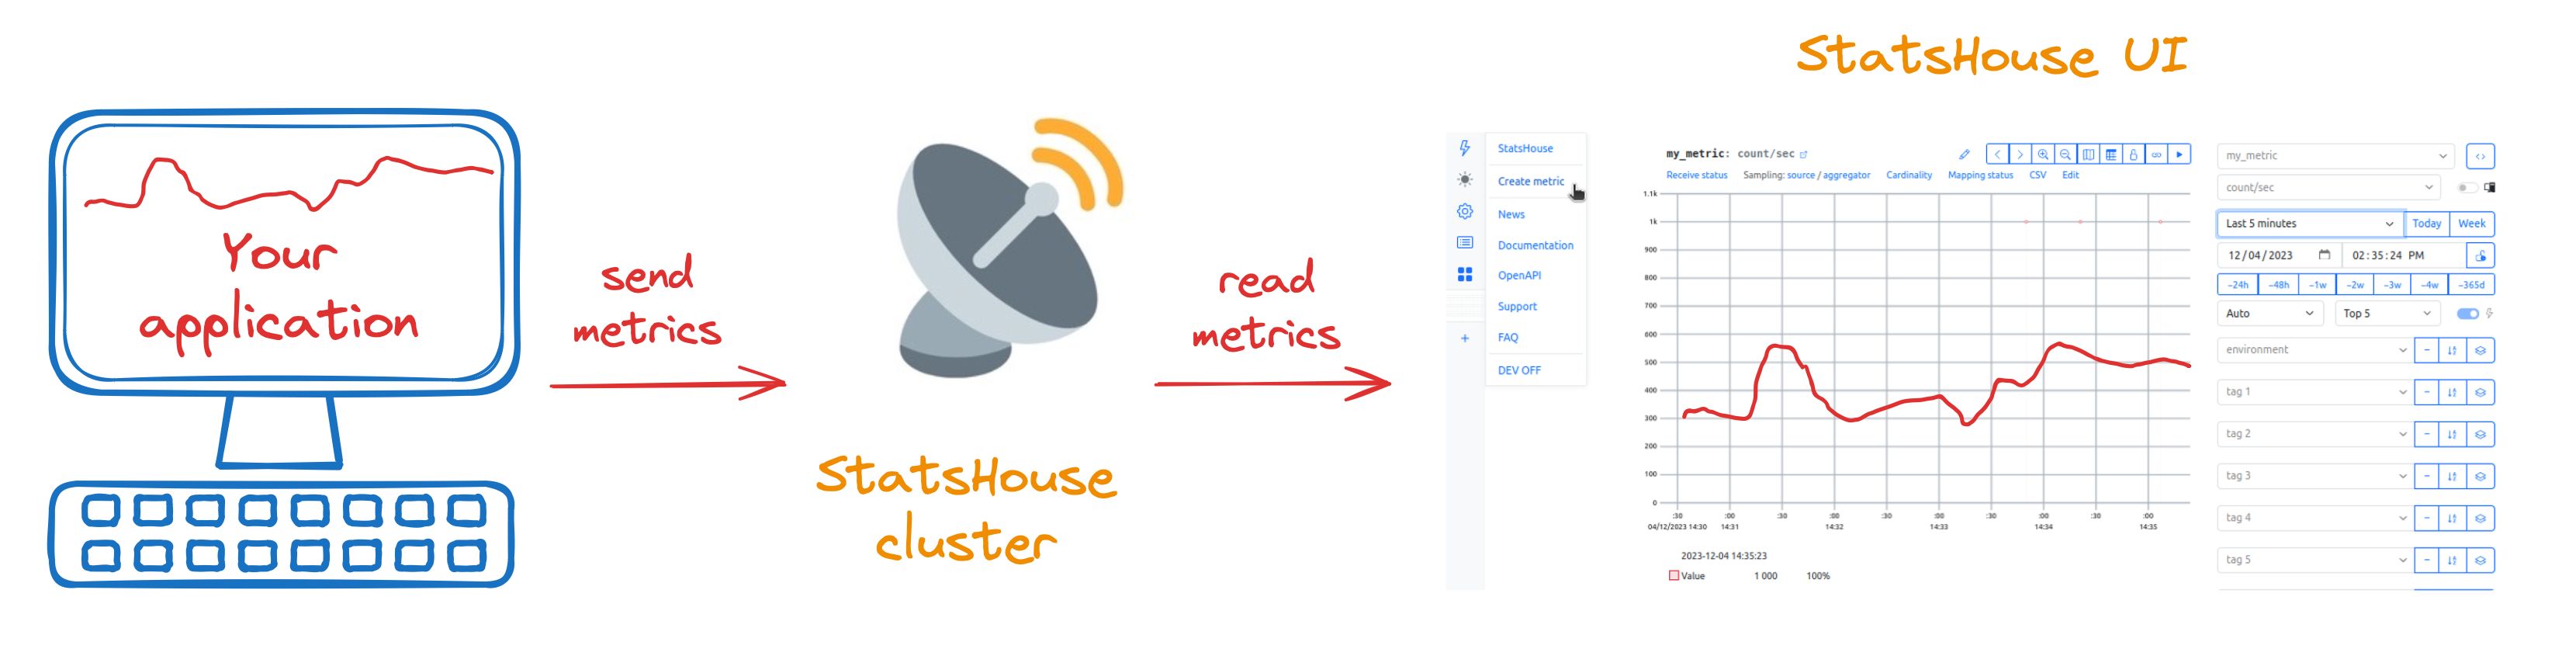
StatsHouse is a monitoring system that is highly available, scalable, and multitenant. One can hardly overload it—due to aggregation and sampling. Read more about StatsHouse features.
It allows your applications to send metric data without limitations, and you can view statistics on a graph in a live mode.
What you can do with StatsHouse
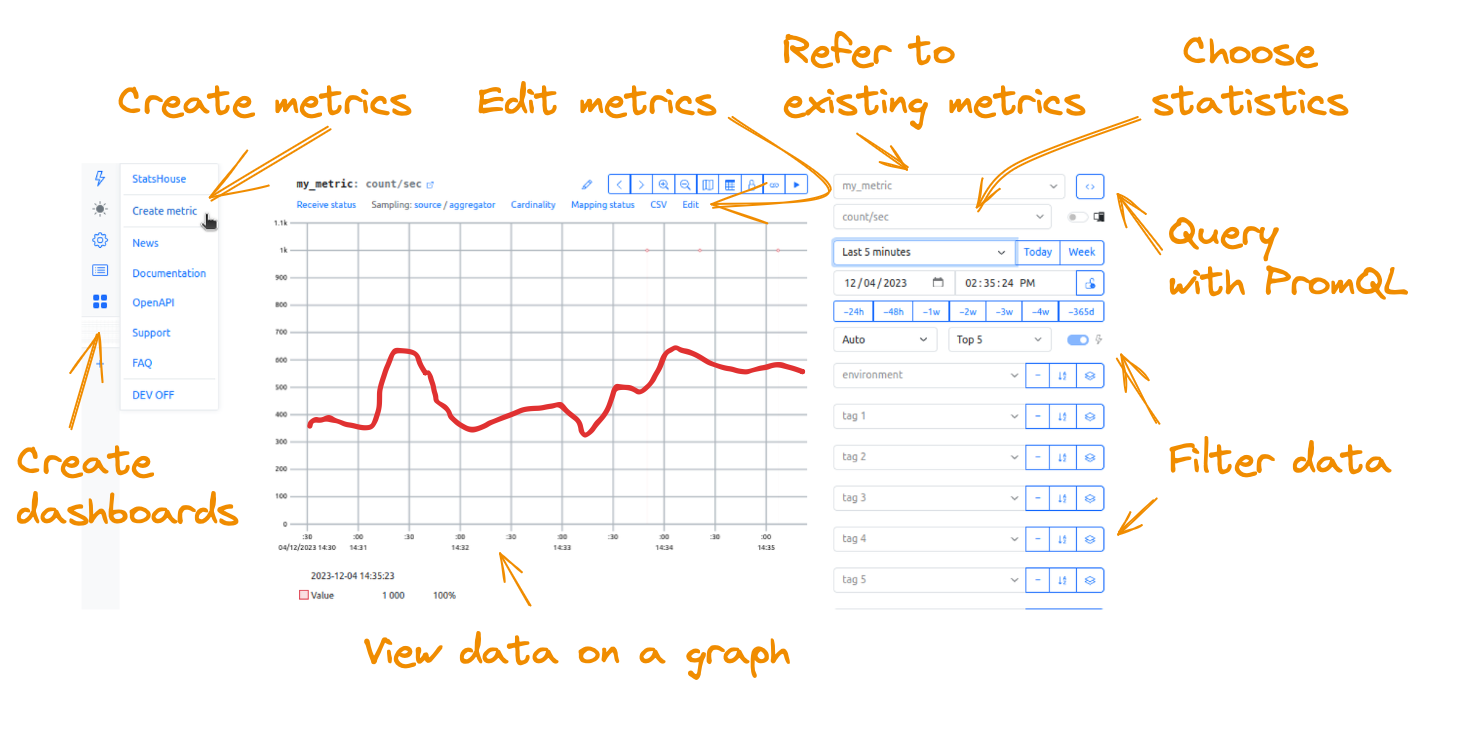
Here is what the StatsHouse user interface looks like and what it basically allows you to do:
What you can find in the docs
Use the 🔍 Search bar in the upper-right corner, or check the table of contents below.
Quick start
- Run StatsHouse locally or access the deployed one
- Send metrics from a demo web server
- Create your own metric
- Send data to your metric
- Check basic viewing options
User guide
- Get access to StatsHouse
- Design your metric
← understand what you want from your metric - Create a metric
- Send metric data
- View data on a graph
← the detailed UI description is here - Edit a metric
- Create and view dashboards
- Query with PromQL
- Find OpenAPI specification
Conceptual overview
- Find more about StatsHouse features.
- Understand the underlying concepts.
- Learn how the StatsHouse components implement all of the above.